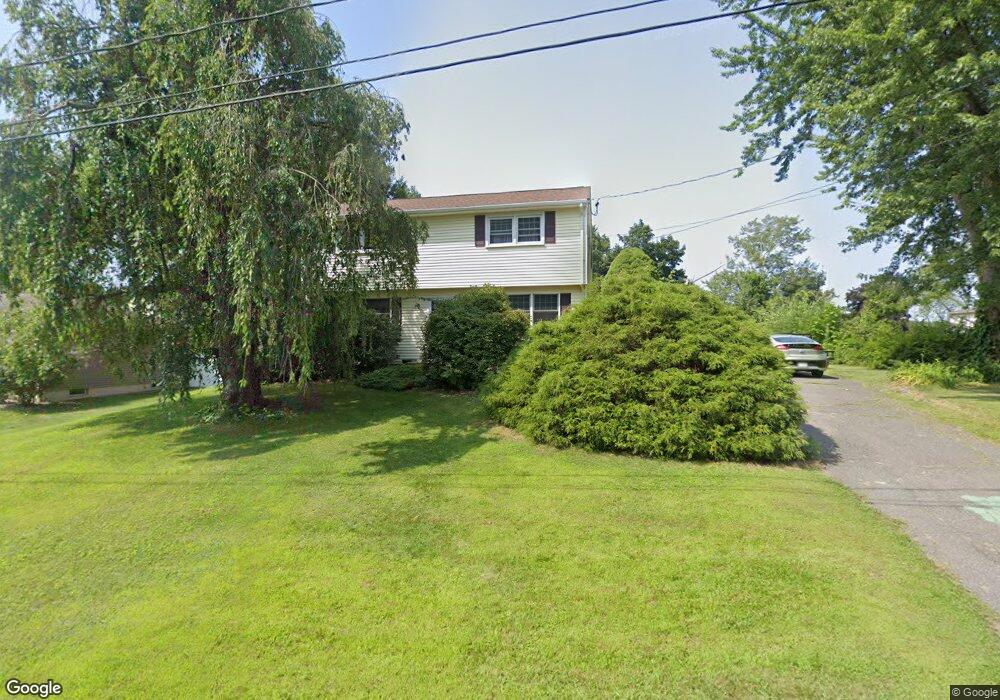
24 Pinewood Rd Ludlow, MA 01056
Estimated Value: $331,000 - $516,000
4
Beds
2
Baths
1,734
Sq Ft
$232/Sq Ft
Est. Value
About This Home
This home is located at 24 Pinewood Rd, Ludlow, MA 01056 and is currently estimated at $402,470, approximately $232 per square foot. 24 Pinewood Rd is a home located in Hampden County with nearby schools including East Street Elementary School, Chapin Street Elementary School, and Paul R. Baird Middle School.
Ownership History
Date
Name
Owned For
Owner Type
Purchase Details
Closed on
May 3, 2004
Sold by
Laplante Dennis J and Laplante Joanne
Bought by
Eagen Marcy J and Eagen William J
Current Estimated Value
Home Financials for this Owner
Home Financials are based on the most recent Mortgage that was taken out on this home.
Original Mortgage
$172,000
Interest Rate
5.36%
Mortgage Type
Purchase Money Mortgage
Purchase Details
Closed on
Sep 11, 1989
Sold by
Wyman Christopher
Bought by
Laplante Dennis J
Purchase Details
Closed on
May 27, 1988
Sold by
Scahill June E
Bought by
Wyman Christopher C
Create a Home Valuation Report for This Property
The Home Valuation Report is an in-depth analysis detailing your home's value as well as a comparison with similar homes in the area
Home Values in the Area
Average Home Value in this Area
Purchase History
| Date | Buyer | Sale Price | Title Company |
|---|---|---|---|
| Eagen Marcy J | $230,000 | -- | |
| Eagen Marcy J | $230,000 | -- | |
| Laplante Dennis J | $140,000 | -- | |
| Wyman Christopher C | $139,000 | -- |
Source: Public Records
Mortgage History
| Date | Status | Borrower | Loan Amount |
|---|---|---|---|
| Open | Wyman Christopher C | $179,000 | |
| Closed | Eagen Marcy J | $172,000 | |
| Previous Owner | Wyman Christopher C | $142,400 |
Source: Public Records
Tax History Compared to Growth
Tax History
| Year | Tax Paid | Tax Assessment Tax Assessment Total Assessment is a certain percentage of the fair market value that is determined by local assessors to be the total taxable value of land and additions on the property. | Land | Improvement |
|---|---|---|---|---|
| 2025 | $4,877 | $281,100 | $110,400 | $170,700 |
| 2024 | $4,754 | $262,800 | $110,300 | $152,500 |
| 2023 | $4,548 | $233,100 | $96,800 | $136,300 |
| 2022 | $4,412 | $220,700 | $96,800 | $123,900 |
| 2021 | $4,496 | $213,300 | $96,800 | $116,500 |
| 2020 | $4,351 | $211,000 | $95,300 | $115,700 |
| 2019 | $4,129 | $208,300 | $94,400 | $113,900 |
| 2018 | $3,914 | $205,900 | $94,400 | $111,500 |
| 2017 | $3,762 | $203,000 | $90,900 | $112,100 |
| 2016 | $3,675 | $202,700 | $89,100 | $113,600 |
Source: Public Records
Map
Nearby Homes
- 665 Center St Unit 705
- 665 Center St Unit 311
- 665 Center St Unit 706
- 70 Sroka Ln
- '0' Rood St
- 84 Chapin Greene Dr
- 425 Miller St
- 51 Parkview St
- 517 Ideal Ln Unit 401
- 138 Ridgeview Cir
- 142 Amherst St
- 173 Colonial Dr
- 334 Munsing St
- 148 Yale St
- 60 Loopley St
- 42 Loopley St
- 87 Haviland St
- 0 Nash Hill Rd
- 519 Lyon St
- 32 White St