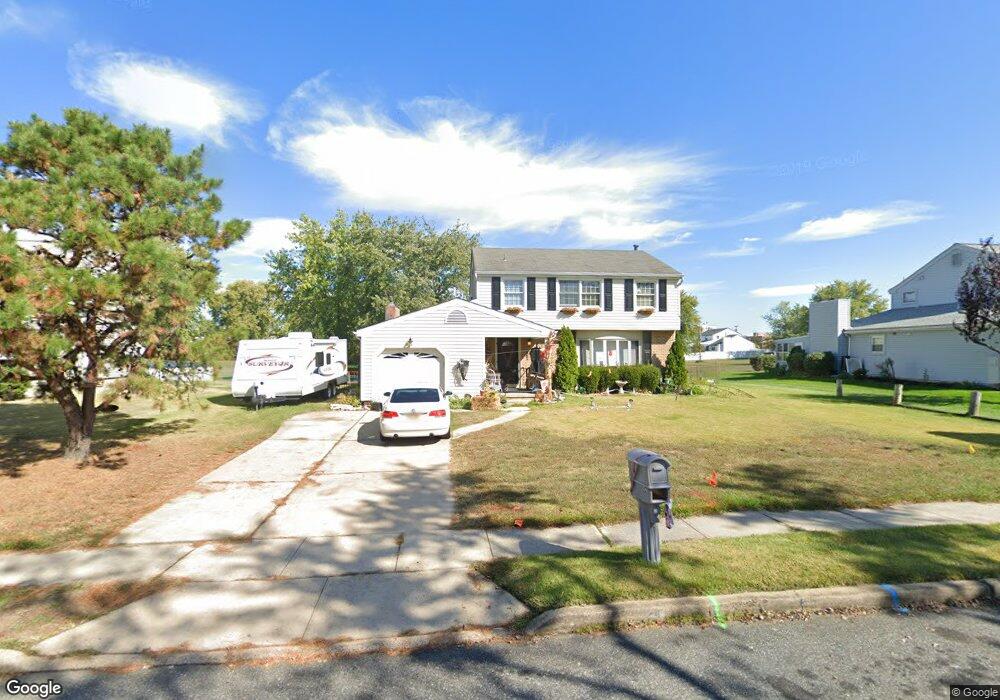
24 Polaris Rd Blackwood, NJ 08012
Washington Township NeighborhoodEstimated Value: $312,521 - $429,000
--
Bed
--
Bath
1,918
Sq Ft
$198/Sq Ft
Est. Value
About This Home
This home is located at 24 Polaris Rd, Blackwood, NJ 08012 and is currently estimated at $378,880, approximately $197 per square foot. 24 Polaris Rd is a home located in Gloucester County with nearby schools including Washington Township High School, Thomas Jefferson Elementary School, and Orchard Valley Middle School.
Ownership History
Date
Name
Owned For
Owner Type
Purchase Details
Closed on
Dec 28, 2004
Sold by
Sbraga Vincent A and Sbraga Suzanne C
Bought by
Sbraga Vincent A and Sbraga Suzanne C
Current Estimated Value
Home Financials for this Owner
Home Financials are based on the most recent Mortgage that was taken out on this home.
Original Mortgage
$111,500
Interest Rate
5.14%
Mortgage Type
Stand Alone Refi Refinance Of Original Loan
Purchase Details
Closed on
Oct 31, 1994
Sold by
Totoro Joseph P and Totoro Ernestine D
Bought by
Sbraga Vincent A and Sbraga Suzanne C
Create a Home Valuation Report for This Property
The Home Valuation Report is an in-depth analysis detailing your home's value as well as a comparison with similar homes in the area
Home Values in the Area
Average Home Value in this Area
Purchase History
| Date | Buyer | Sale Price | Title Company |
|---|---|---|---|
| Sbraga Vincent A | -- | -- | |
| Sbraga Vincent A | $115,500 | Congress Title Corp |
Source: Public Records
Mortgage History
| Date | Status | Borrower | Loan Amount |
|---|---|---|---|
| Closed | Sbraga Vincent A | $111,500 |
Source: Public Records
Tax History Compared to Growth
Tax History
| Year | Tax Paid | Tax Assessment Tax Assessment Total Assessment is a certain percentage of the fair market value that is determined by local assessors to be the total taxable value of land and additions on the property. | Land | Improvement |
|---|---|---|---|---|
| 2025 | $7,272 | $196,600 | $42,500 | $154,100 |
| 2024 | $7,068 | $196,600 | $42,500 | $154,100 |
| 2023 | $7,068 | $196,600 | $42,500 | $154,100 |
| 2022 | $6,836 | $196,600 | $42,500 | $154,100 |
| 2021 | $5,036 | $196,600 | $42,500 | $154,100 |
| 2020 | $6,647 | $196,600 | $42,500 | $154,100 |
| 2019 | $6,557 | $179,900 | $37,500 | $142,400 |
| 2018 | $6,484 | $179,900 | $37,500 | $142,400 |
| 2017 | $6,403 | $179,900 | $37,500 | $142,400 |
| 2016 | $6,365 | $179,900 | $37,500 | $142,400 |
| 2015 | $6,275 | $179,900 | $37,500 | $142,400 |
| 2014 | $6,077 | $179,900 | $37,500 | $142,400 |
Source: Public Records
Map
Nearby Homes
- 50 Fomalhaut Ave
- 13 Camelot Place
- 18 Brighton Place
- 15 Ipswich Place Unit BUILDING N
- 5 Kent Place
- 4 Corvas Ct
- 19 Ptolemy Ct
- 19 Canterbury Ct
- 54 Libra Ln
- 3 Windsor Ct Unit D3
- 31 Windsor Ct
- 109 Fomalhaut Ave
- 8 Michele Ct
- 10 Birch Grove Ln
- 36 Bridge Dr
- 8 Charles Carroll Bldg
- 1755 Congress Dr
- 46 Maple Leaf Cir
- 1 Quail Hollow Dr
- 2 White Birch Ct