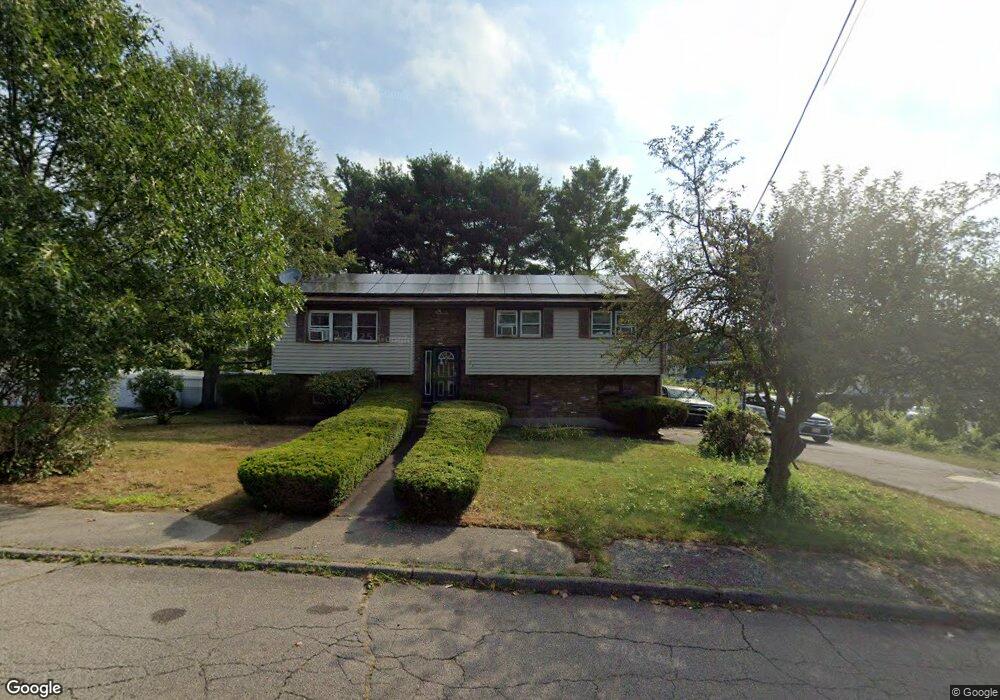
24 Quarry Rd Randolph, MA 02368
South Randolph NeighborhoodEstimated Value: $515,000 - $607,000
3
Beds
2
Baths
1,660
Sq Ft
$345/Sq Ft
Est. Value
About This Home
This home is located at 24 Quarry Rd, Randolph, MA 02368 and is currently estimated at $571,956, approximately $344 per square foot. 24 Quarry Rd is a home located in Norfolk County with nearby schools including Randolph High School, Boston Higashi School, and Lighthouse Baptist Christian Academy.
Ownership History
Date
Name
Owned For
Owner Type
Purchase Details
Closed on
May 12, 2016
Sold by
Osuagwu Iheanyi
Bought by
Osuagwu Chiaka O and Osuagwu Ogueri D
Current Estimated Value
Home Financials for this Owner
Home Financials are based on the most recent Mortgage that was taken out on this home.
Original Mortgage
$237,840
Outstanding Balance
$184,717
Interest Rate
3.71%
Mortgage Type
FHA
Estimated Equity
$387,239
Purchase Details
Closed on
Oct 2, 2009
Sold by
Deutsche Bank Natl T C
Bought by
Osuagwu Iheanyi
Home Financials for this Owner
Home Financials are based on the most recent Mortgage that was taken out on this home.
Original Mortgage
$241,656
Interest Rate
5.12%
Mortgage Type
Purchase Money Mortgage
Purchase Details
Closed on
Sep 25, 2009
Sold by
Ramos Patricia and Deutsche Bank Natl T C
Bought by
Deutsche Bank Natl T C
Home Financials for this Owner
Home Financials are based on the most recent Mortgage that was taken out on this home.
Original Mortgage
$241,656
Interest Rate
5.12%
Mortgage Type
Purchase Money Mortgage
Purchase Details
Closed on
Apr 15, 2009
Sold by
Deutsche Bank Natl T C and Ramos
Bought by
Deutsche Bank Natl T C
Purchase Details
Closed on
Jul 5, 2006
Sold by
Ramos Maritza and Ramos Roberto
Bought by
Ramos Patricia
Home Financials for this Owner
Home Financials are based on the most recent Mortgage that was taken out on this home.
Original Mortgage
$336,000
Interest Rate
6.6%
Mortgage Type
Purchase Money Mortgage
Purchase Details
Closed on
May 27, 2005
Sold by
Dang Dana T D and Ly Son
Bought by
Ramos Maritza and Ramos Roberto A
Home Financials for this Owner
Home Financials are based on the most recent Mortgage that was taken out on this home.
Original Mortgage
$310,400
Interest Rate
5.94%
Mortgage Type
Purchase Money Mortgage
Purchase Details
Closed on
Jun 1, 2001
Sold by
Schlossberg Charles D and Schlossberg Judith A
Bought by
Ly Son
Create a Home Valuation Report for This Property
The Home Valuation Report is an in-depth analysis detailing your home's value as well as a comparison with similar homes in the area
Home Values in the Area
Average Home Value in this Area
Purchase History
| Date | Buyer | Sale Price | Title Company |
|---|---|---|---|
| Osuagwu Chiaka O | $275,000 | -- | |
| Osuagwu Iheanyi | $250,000 | -- | |
| Deutsche Bank Natl T C | $215,000 | -- | |
| Deutsche Bank Natl T C | $215,000 | -- | |
| Ramos Patricia | $420,000 | -- | |
| Ramos Patricia | $420,000 | -- | |
| Ramos Maritza | $388,000 | -- | |
| Ramos Maritza | $388,000 | -- | |
| Ly Son | $197,000 | -- |
Source: Public Records
Mortgage History
| Date | Status | Borrower | Loan Amount |
|---|---|---|---|
| Open | Osuagwu Chiaka O | $237,840 | |
| Previous Owner | Osuagwu Iheanyi | $241,656 | |
| Previous Owner | Ramos Patricia | $336,000 | |
| Previous Owner | Ramos Patricia | $53,000 | |
| Previous Owner | Ramos Maritza | $310,400 | |
| Previous Owner | Ramos Maritza | $38,800 |
Source: Public Records
Tax History
| Year | Tax Paid | Tax Assessment Tax Assessment Total Assessment is a certain percentage of the fair market value that is determined by local assessors to be the total taxable value of land and additions on the property. | Land | Improvement |
|---|---|---|---|---|
| 2025 | $6,001 | $516,900 | $246,700 | $270,200 |
| 2024 | $5,877 | $513,300 | $242,000 | $271,300 |
| 2023 | $5,571 | $461,200 | $220,000 | $241,200 |
| 2022 | $5,349 | $393,300 | $183,400 | $209,900 |
| 2021 | $5,099 | $345,000 | $152,800 | $192,200 |
| 2020 | $4,971 | $333,400 | $152,800 | $180,600 |
| 2019 | $5,030 | $335,800 | $145,400 | $190,400 |
| 2018 | $4,780 | $301,000 | $134,800 | $166,200 |
| 2017 | $4,739 | $292,900 | $128,400 | $164,500 |
| 2016 | $4,608 | $265,000 | $116,700 | $148,300 |
| 2015 | $4,512 | $249,300 | $111,200 | $138,100 |
Source: Public Records
Map
Nearby Homes
- 20 Quarry Rd
- 53 N Glenway Ave
- 7 Katy Cir
- 6 Katy Cir
- 27 Quarry Rd
- 23 Quarry Rd
- 46 N Glenway Ave
- 57 N Glenway Ave
- 51 N Glenway Ave
- 16 Quarry Rd
- 17 Katy Cir
- 17 Katy Cir Unit 1
- 19 Quarry Rd
- 58 N Glenway Ave
- 58 N Glenway Ave Unit 1
- 45 N Glenway Ave
- 44 N Glenway Ave
- 15 Quarry Rd
- 23 Katy Cir
- 61 N Glenway Ave
Your Personal Tour Guide
Ask me questions while you tour the home.