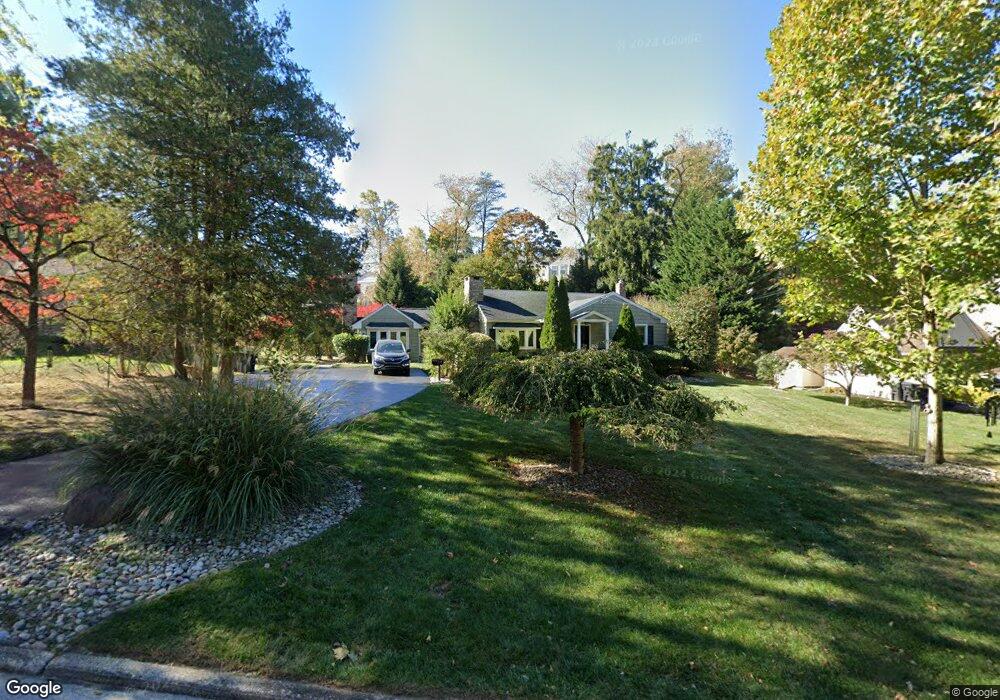
24 Robins Ln Berwyn, PA 19312
Estimated Value: $606,505 - $841,000
3
Beds
1
Bath
1,794
Sq Ft
$383/Sq Ft
Est. Value
About This Home
This home is located at 24 Robins Ln, Berwyn, PA 19312 and is currently estimated at $687,626, approximately $383 per square foot. 24 Robins Ln is a home located in Chester County with nearby schools including Hillside Elementary School, Valley Forge Middle School, and Conestoga Senior High School.
Ownership History
Date
Name
Owned For
Owner Type
Purchase Details
Closed on
Dec 8, 2006
Sold by
Cook Peter B and Cook Dana Mcculley
Bought by
Sanborn Paul J and Sanborn Therese
Current Estimated Value
Home Financials for this Owner
Home Financials are based on the most recent Mortgage that was taken out on this home.
Original Mortgage
$310,000
Outstanding Balance
$183,383
Interest Rate
6.12%
Mortgage Type
Purchase Money Mortgage
Estimated Equity
$504,243
Purchase Details
Closed on
Jul 2, 2001
Sold by
Loy Myrna L
Bought by
Cook Peter B and Cook Dana Mcculley
Home Financials for this Owner
Home Financials are based on the most recent Mortgage that was taken out on this home.
Original Mortgage
$205,200
Interest Rate
7.2%
Purchase Details
Closed on
Feb 10, 1999
Sold by
Caprio Vincent J and Caprio Catherine M
Bought by
Loy Myrna L
Home Financials for this Owner
Home Financials are based on the most recent Mortgage that was taken out on this home.
Original Mortgage
$145,600
Interest Rate
6.75%
Create a Home Valuation Report for This Property
The Home Valuation Report is an in-depth analysis detailing your home's value as well as a comparison with similar homes in the area
Home Values in the Area
Average Home Value in this Area
Purchase History
| Date | Buyer | Sale Price | Title Company |
|---|---|---|---|
| Sanborn Paul J | $399,900 | None Available | |
| Cook Peter B | $216,000 | -- | |
| Loy Myrna L | $182,000 | -- |
Source: Public Records
Mortgage History
| Date | Status | Borrower | Loan Amount |
|---|---|---|---|
| Open | Sanborn Paul J | $310,000 | |
| Previous Owner | Cook Peter B | $205,200 | |
| Previous Owner | Loy Myrna L | $145,600 |
Source: Public Records
Tax History Compared to Growth
Tax History
| Year | Tax Paid | Tax Assessment Tax Assessment Total Assessment is a certain percentage of the fair market value that is determined by local assessors to be the total taxable value of land and additions on the property. | Land | Improvement |
|---|---|---|---|---|
| 2025 | $5,179 | $147,030 | $54,290 | $92,740 |
| 2024 | $5,179 | $147,030 | $54,290 | $92,740 |
| 2023 | $4,865 | $147,030 | $54,290 | $92,740 |
| 2022 | $4,739 | $147,030 | $54,290 | $92,740 |
| 2021 | $4,649 | $147,030 | $54,290 | $92,740 |
| 2020 | $4,521 | $147,030 | $54,290 | $92,740 |
| 2019 | $4,378 | $147,030 | $54,290 | $92,740 |
| 2018 | $4,291 | $147,030 | $54,290 | $92,740 |
| 2017 | $4,189 | $147,030 | $54,290 | $92,740 |
| 2016 | -- | $147,030 | $54,290 | $92,740 |
| 2015 | -- | $147,030 | $54,290 | $92,740 |
| 2014 | -- | $147,030 | $54,290 | $92,740 |
Source: Public Records
Map
Nearby Homes
- 1242 Old Lancaster Rd
- 211 Wooded Way
- 896 Conestoga Rd
- 5 Kent Ln
- 32 Manchester Ct
- 1441 Berwyn Paoli Rd
- 109 Vincent Rd
- 327 Stoney Knoll Lane - Lot 5
- 91 Central Ave
- 202 Shoreline Dr
- 1250 Swedesford Rd
- 521 Foxwood Ln
- 119 Waterloo Ave
- 793 Tory Hollow Rd
- 553 Woodside Ave
- 2102 Quail Ridge Dr
- 106 N Valley Rd
- 1304 Weatherstone Dr Unit 1304
- 1705 Weatherstone Dr
- 1 Whitworth Ave