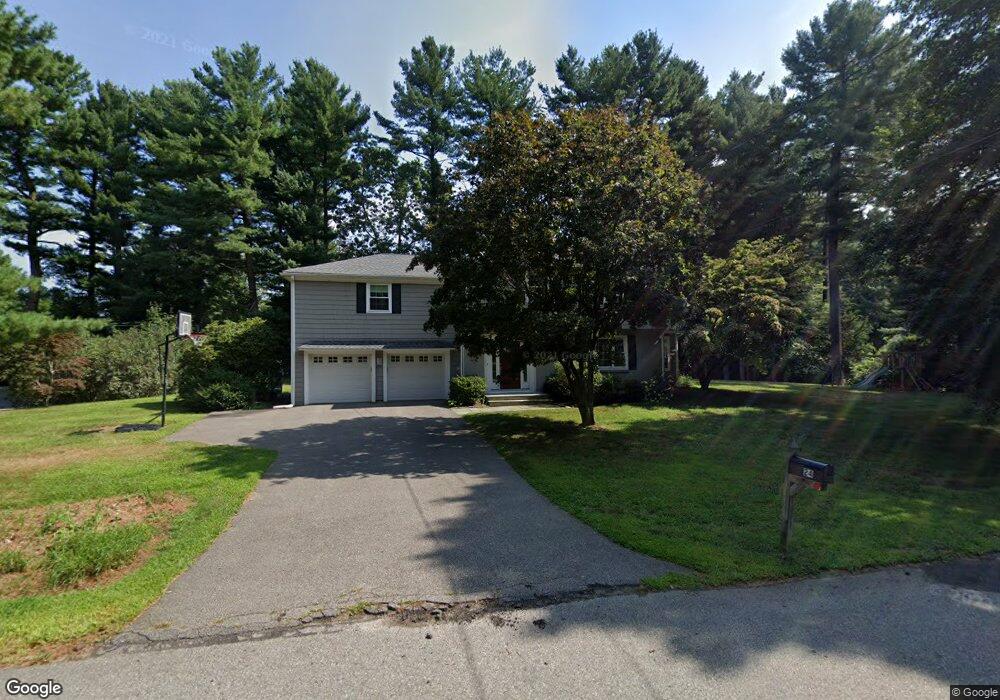
24 Rolling Ln Wayland, MA 01778
Estimated Value: $1,283,000 - $1,476,000
4
Beds
3
Baths
2,776
Sq Ft
$481/Sq Ft
Est. Value
About This Home
This home is located at 24 Rolling Ln, Wayland, MA 01778 and is currently estimated at $1,336,464, approximately $481 per square foot. 24 Rolling Ln is a home located in Middlesex County with nearby schools including Wayland High School and Veritas Christian Academy.
Ownership History
Date
Name
Owned For
Owner Type
Purchase Details
Closed on
Sep 21, 2018
Sold by
Hwang Diana W
Bought by
Lien Diana
Current Estimated Value
Purchase Details
Closed on
Jul 24, 1992
Sold by
Lee Kun Hyung and Lee Yeun Ok
Bought by
Hwang Diana W and Lien James C
Purchase Details
Closed on
Sep 8, 1989
Sold by
Meszaros David P
Bought by
Lee Kun Hyung
Create a Home Valuation Report for This Property
The Home Valuation Report is an in-depth analysis detailing your home's value as well as a comparison with similar homes in the area
Home Values in the Area
Average Home Value in this Area
Purchase History
| Date | Buyer | Sale Price | Title Company |
|---|---|---|---|
| Lien Diana | -- | -- | |
| Lien Diana | -- | -- | |
| Hwang Diana W | $275,000 | -- | |
| Lee Kun Hyung | $310,000 | -- |
Source: Public Records
Mortgage History
| Date | Status | Borrower | Loan Amount |
|---|---|---|---|
| Previous Owner | Lee Kun Hyung | $186,000 | |
| Previous Owner | Lee Kun Hyung | $270,000 |
Source: Public Records
Tax History Compared to Growth
Tax History
| Year | Tax Paid | Tax Assessment Tax Assessment Total Assessment is a certain percentage of the fair market value that is determined by local assessors to be the total taxable value of land and additions on the property. | Land | Improvement |
|---|---|---|---|---|
| 2025 | $17,043 | $1,090,400 | $525,900 | $564,500 |
| 2024 | $16,141 | $1,040,000 | $500,800 | $539,200 |
| 2023 | $15,150 | $909,900 | $455,300 | $454,600 |
| 2022 | $14,065 | $766,500 | $377,100 | $389,400 |
| 2021 | $15,038 | $732,100 | $342,700 | $389,400 |
| 2020 | $14,317 | $732,100 | $342,700 | $389,400 |
| 2019 | $12,451 | $681,100 | $326,500 | $354,600 |
| 2018 | $7,744 | $646,300 | $326,500 | $319,800 |
| 2017 | $11,363 | $626,400 | $316,600 | $309,800 |
| 2016 | $10,732 | $618,900 | $310,300 | $308,600 |
| 2015 | $10,955 | $595,700 | $310,300 | $285,400 |
Source: Public Records
Map
Nearby Homes
- 47 Pequot Rd
- 37 Pequot Rd
- 208 Cochituate Rd
- 260 Cochituate Rd
- 22 Lakeshore Dr
- 26 Dudley Rd
- 353 Old Connecticut Path
- 96 Lakeshore Dr
- 96 Lake Shore Dr
- 15 Crest Rd
- 7 Shaw Dr
- 108 Dudley Rd
- 123 Dudley Rd
- 28 Joyce Rd
- 3 Keith Rd
- 5 Brook Trail Rd
- 35 Wallace Rd
- 11 White Pine Knoll Rd
- 125 Woodridge Rd
- 233 Lakeshore Dr