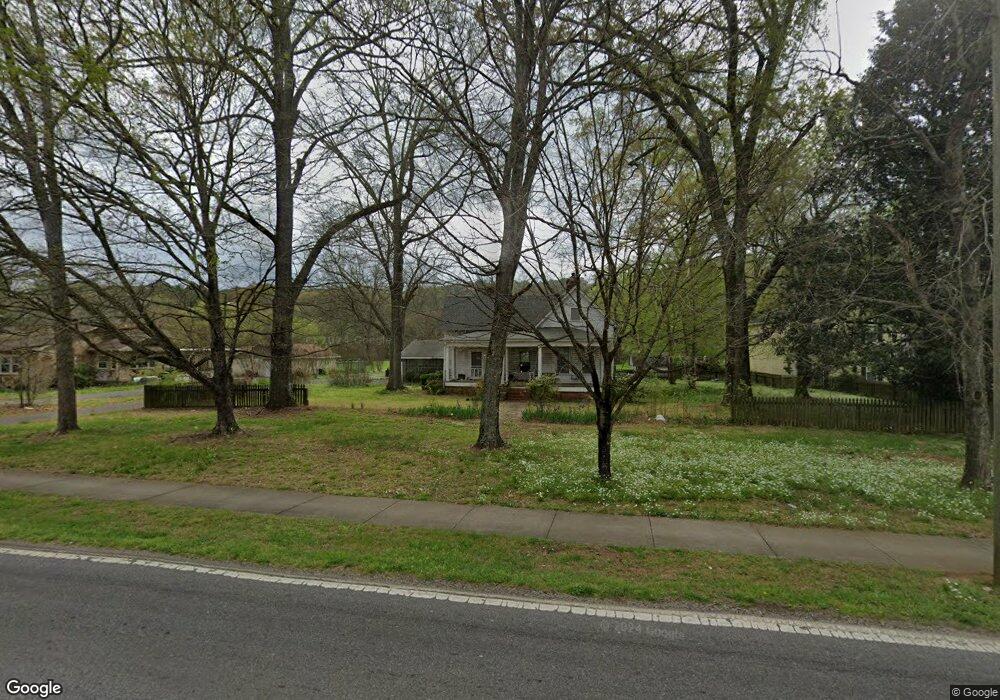
24 Rome Rd SW Cave Spring, GA 30124
Estimated Value: $169,073 - $204,000
Studio
--
Bath
1,504
Sq Ft
$126/Sq Ft
Est. Value
About This Home
This home is located at 24 Rome Rd SW, Cave Spring, GA 30124 and is currently estimated at $190,018, approximately $126 per square foot. 24 Rome Rd SW is a home with nearby schools including Coosa Middle School and Coosa High School.
Ownership History
Date
Name
Owned For
Owner Type
Purchase Details
Closed on
Jan 22, 2010
Sold by
Harbin Paulette G
Bought by
Harbin Paulette G Harbin Jenn
Current Estimated Value
Purchase Details
Closed on
Mar 21, 2006
Sold by
Not Provided
Bought by
Harbin Jennifer Danette
Purchase Details
Closed on
Mar 20, 2006
Sold by
Not Provided
Bought by
Harbin Jennifer Danette
Purchase Details
Closed on
Dec 13, 2005
Sold by
Harbin Paulette G
Bought by
Harbin Paulette G
Purchase Details
Closed on
Jul 2, 1986
Sold by
Montgomery Hugh L and Montgomer Hugh L
Bought by
Harbin Harbin W and Harbin Paulette
Purchase Details
Closed on
Jan 31, 1985
Sold by
Montgomery Wilson and Montgomery Hugh L
Bought by
Montgomery Hugh L and Mont Hugh L
Purchase Details
Closed on
Nov 24, 1981
Sold by
Montgomery Wilson and Montgomery Edythe D
Bought by
Montgomery Wilson and Montgome Hugh L
Purchase Details
Closed on
Feb 21, 1966
Bought by
P and R
Purchase Details
Closed on
Jan 1, 1946
Bought by
Montgomery Wilson and Montgomery Edythe D
Create a Home Valuation Report for This Property
The Home Valuation Report is an in-depth analysis detailing your home's value as well as a comparison with similar homes in the area
Purchase History
| Date | Buyer | Sale Price | Title Company |
|---|---|---|---|
| Harbin Paulette G Harbin Jenn | -- | -- | |
| Harbin Jennifer Danette | -- | -- | |
| Harbin Jennifer Danette | -- | -- | |
| Harbin Paulette G | -- | -- | |
| Harbin Harbin W | $42,500 | -- | |
| Montgomery Hugh L | $10,000 | -- | |
| Montgomery Wilson | -- | -- | |
| P | -- | -- | |
| Montgomery Wilson | -- | -- |
Source: Public Records
Tax History
| Year | Tax Paid | Tax Assessment Tax Assessment Total Assessment is a certain percentage of the fair market value that is determined by local assessors to be the total taxable value of land and additions on the property. | Land | Improvement |
|---|---|---|---|---|
| 2025 | $701 | $68,242 | $8,567 | $59,675 |
| 2024 | $701 | $63,185 | $7,788 | $55,397 |
| 2023 | $704 | $63,741 | $7,080 | $56,661 |
| 2022 | $545 | $53,184 | $5,664 | $47,520 |
| 2021 | $417 | $45,505 | $5,664 | $39,841 |
| 2020 | $192 | $41,978 | $4,248 | $37,730 |
| 2019 | $185 | $39,836 | $4,248 | $35,588 |
| 2018 | $185 | $37,724 | $4,248 | $33,476 |
| 2017 | $780 | $36,470 | $4,248 | $32,222 |
| 2016 | $579 | $25,133 | $4,240 | $20,893 |
| 2015 | $570 | $25,133 | $4,240 | $20,893 |
| 2014 | $570 | $25,133 | $4,240 | $20,893 |
Source: Public Records
Map
Nearby Homes
- 38 Alabama St
- 57 Mill St
- 0 Mill Rd Unit 10629874
- 0 Mill Rd Unit 7670319
- 0 Mill St SW Unit 11671446
- 5598 Fosters Mill Rd
- 700 Gadsden Rd SW
- 0 Melson Rd SW Unit 7676052
- 0 Melson Rd SW Unit 10636997
- 475 Davis Rd SW
- 907 Gadsden Rd SW
- 7112 C Blacks Bluff Rd
- 5981 Blacks Bluff Rd SW
- 914 Chubbtown Rd
- 0 Santa Claus Rd Unit 7735787
- 0 Santa Claus Rd Unit 7706526
- 0 Santa Claus Rd Unit 10676218
- 612 Michael Blvd
- 75 Weaver Rd
- 387 Michael Blvd
- 26 Rome Rd SW
- 15 Rome St
- 18 Highway 411
- 16 Cave Spring St SW Unit ST
- 16 Cave Spring St SW
- 14 Rome Rd SW
- 34 Cave Spring St SW
- 12 Rome Rd SW
- 3 Georgia Ave
- 11 School Ln
- 8 U S 411
- 8 Rome Rd SW
- 8 Highway 411
- 1 Georgia Ave
- 4 River St SW
- 3 River St SW
- 1 Rome Rd SW
- 10 Alabama St
- 8.09 Acres On Cut Log Road Tract 7
- 6 Broad St
Your Personal Tour Guide
Ask me questions while you tour the home.