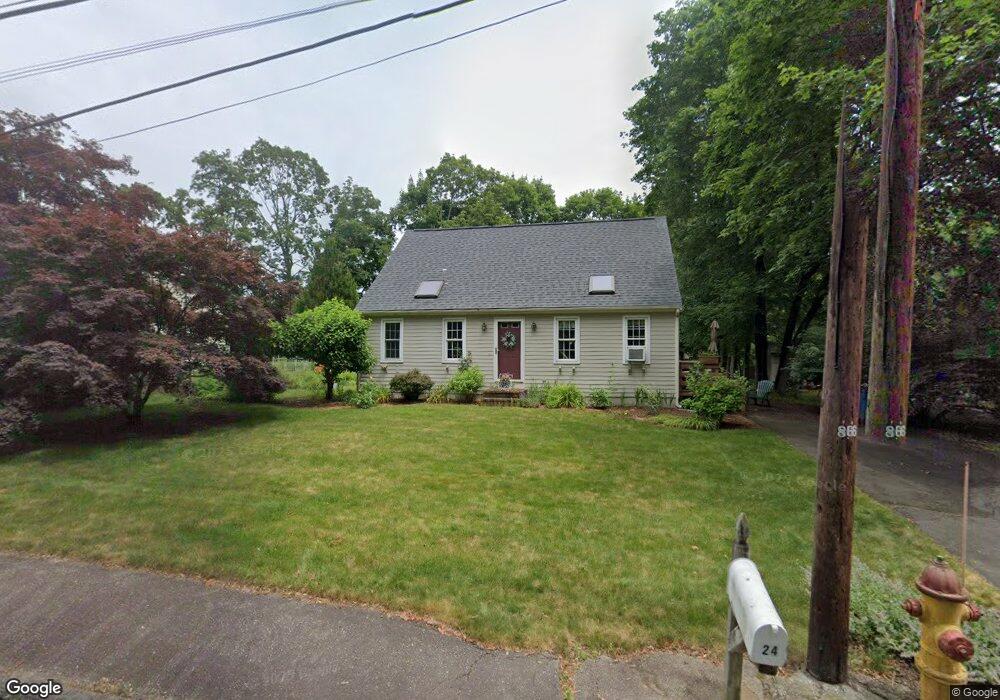
24 Roy Ave Attleboro, MA 02703
Estimated Value: $458,000 - $538,000
3
Beds
1
Bath
952
Sq Ft
$508/Sq Ft
Est. Value
About This Home
This home is located at 24 Roy Ave, Attleboro, MA 02703 and is currently estimated at $483,951, approximately $508 per square foot. 24 Roy Ave is a home located in Bristol County with nearby schools including Hill-Roberts Elementary School, Robert J. Coelho Middle School, and Attleboro High School.
Ownership History
Date
Name
Owned For
Owner Type
Purchase Details
Closed on
Jun 30, 1995
Sold by
Cedar Ridge Dev Inc
Bought by
Milton Patricia J
Current Estimated Value
Home Financials for this Owner
Home Financials are based on the most recent Mortgage that was taken out on this home.
Original Mortgage
$88,800
Interest Rate
7.8%
Mortgage Type
Purchase Money Mortgage
Purchase Details
Closed on
Jun 21, 1995
Sold by
Eg Mellon Inc
Bought by
Cedar Ridge Dev Inc
Home Financials for this Owner
Home Financials are based on the most recent Mortgage that was taken out on this home.
Original Mortgage
$88,800
Interest Rate
7.8%
Mortgage Type
Purchase Money Mortgage
Purchase Details
Closed on
Apr 24, 1995
Sold by
Bertrand Philias and Bertrand Blanche M
Bought by
Eg Mellon Inc
Home Financials for this Owner
Home Financials are based on the most recent Mortgage that was taken out on this home.
Original Mortgage
$75,000
Interest Rate
7.82%
Mortgage Type
Purchase Money Mortgage
Create a Home Valuation Report for This Property
The Home Valuation Report is an in-depth analysis detailing your home's value as well as a comparison with similar homes in the area
Home Values in the Area
Average Home Value in this Area
Purchase History
| Date | Buyer | Sale Price | Title Company |
|---|---|---|---|
| Milton Patricia J | $111,050 | -- | |
| Cedar Ridge Dev Inc | $40,000 | -- | |
| Eg Mellon Inc | $15,000 | -- |
Source: Public Records
Mortgage History
| Date | Status | Borrower | Loan Amount |
|---|---|---|---|
| Open | Eg Mellon Inc | $78,000 | |
| Closed | Eg Mellon Inc | $88,800 | |
| Closed | Eg Mellon Inc | $75,000 |
Source: Public Records
Tax History
| Year | Tax Paid | Tax Assessment Tax Assessment Total Assessment is a certain percentage of the fair market value that is determined by local assessors to be the total taxable value of land and additions on the property. | Land | Improvement |
|---|---|---|---|---|
| 2025 | $4,991 | $397,700 | $144,300 | $253,400 |
| 2024 | $4,891 | $384,200 | $144,300 | $239,900 |
| 2023 | $4,735 | $345,900 | $131,300 | $214,600 |
| 2022 | $4,530 | $313,500 | $125,000 | $188,500 |
| 2021 | $3,963 | $267,800 | $120,300 | $147,500 |
| 2020 | $3,911 | $268,600 | $116,800 | $151,800 |
| 2019 | $3,459 | $244,300 | $114,700 | $129,600 |
| 2018 | $3,520 | $237,500 | $111,200 | $126,300 |
| 2017 | $3,658 | $251,400 | $111,200 | $140,200 |
| 2016 | $3,647 | $246,100 | $109,200 | $136,900 |
| 2015 | $3,385 | $230,100 | $109,200 | $120,900 |
| 2014 | $3,113 | $209,600 | $104,000 | $105,600 |
Source: Public Records
Map
Nearby Homes
Your Personal Tour Guide
Ask me questions while you tour the home.