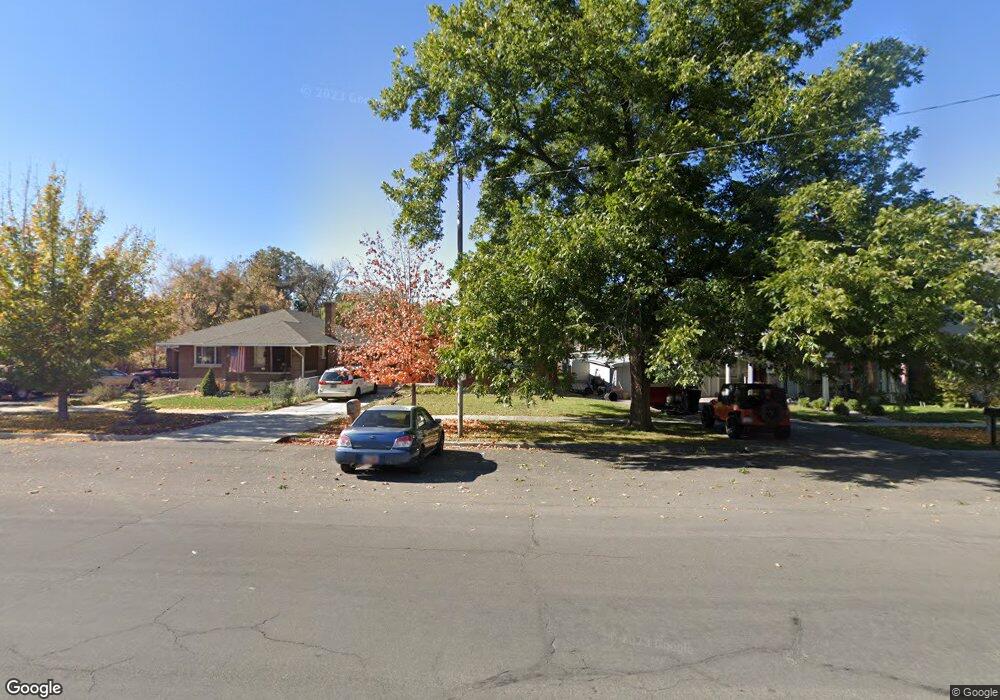
24 S 200 W Springville, UT 84663
Estimated Value: $485,378 - $532,000
4
Beds
3
Baths
1,400
Sq Ft
$359/Sq Ft
Est. Value
About This Home
This home is located at 24 S 200 W, Springville, UT 84663 and is currently estimated at $502,793, approximately $359 per square foot. 24 S 200 W is a home located in Utah County with nearby schools including Westside Elementary School, Springville Junior High School, and Springville High School.
Ownership History
Date
Name
Owned For
Owner Type
Purchase Details
Closed on
Apr 4, 2018
Sold by
Spencer Tracy A and Jones Jack H
Bought by
Jones Corie
Current Estimated Value
Purchase Details
Closed on
Oct 14, 2013
Sold by
Spencer Reyn K and Spencer Tracy A
Bought by
Spencer Reyn K
Home Financials for this Owner
Home Financials are based on the most recent Mortgage that was taken out on this home.
Original Mortgage
$50,000
Outstanding Balance
$37,009
Interest Rate
4.12%
Mortgage Type
Credit Line Revolving
Estimated Equity
$465,784
Purchase Details
Closed on
Jul 26, 2000
Sold by
Condie Phyllis
Bought by
Spencer Reyn K and Spencer Tracy A
Home Financials for this Owner
Home Financials are based on the most recent Mortgage that was taken out on this home.
Original Mortgage
$22,149
Interest Rate
8.2%
Create a Home Valuation Report for This Property
The Home Valuation Report is an in-depth analysis detailing your home's value as well as a comparison with similar homes in the area
Home Values in the Area
Average Home Value in this Area
Purchase History
| Date | Buyer | Sale Price | Title Company |
|---|---|---|---|
| Jones Corie | -- | None Available | |
| Spencer Reyn K | -- | Pro Title And Escrow Inc | |
| Spencer Reyn K | -- | Backman Stewart Title | |
| Condie Phyllis | -- | Backman Stewart Title |
Source: Public Records
Mortgage History
| Date | Status | Borrower | Loan Amount |
|---|---|---|---|
| Open | Spencer Reyn K | $50,000 | |
| Closed | Condie Phyllis | $22,149 |
Source: Public Records
Tax History
| Year | Tax Paid | Tax Assessment Tax Assessment Total Assessment is a certain percentage of the fair market value that is determined by local assessors to be the total taxable value of land and additions on the property. | Land | Improvement |
|---|---|---|---|---|
| 2025 | $2,377 | $264,440 | -- | -- |
| 2024 | $2,377 | $243,485 | $0 | $0 |
| 2023 | $2,282 | $234,025 | $0 | $0 |
| 2022 | $2,292 | $230,835 | $0 | $0 |
| 2021 | $2,059 | $322,800 | $85,300 | $237,500 |
| 2020 | $1,911 | $290,400 | $71,100 | $219,300 |
| 2019 | $1,856 | $287,200 | $67,900 | $219,300 |
| 2018 | $1,745 | $257,600 | $61,300 | $196,300 |
| 2017 | $1,706 | $133,760 | $0 | $0 |
| 2016 | $1,591 | $122,265 | $0 | $0 |
| 2015 | $1,460 | $114,730 | $0 | $0 |
| 2014 | $1,415 | $110,495 | $0 | $0 |
Source: Public Records
Map
Nearby Homes
- 311 W Center St
- 393 W Center St
- 231 N 100 W
- 147 N 100 E
- 476 W 200 N Unit 108
- 476 W 200 N Unit 206
- 58 W 300 N
- 110 S 200 E
- 550 S 400 W
- 30 N 200 E
- 72 E 400 S
- 511 W 300 S Unit A
- 156 N 600 W
- 224 S 550 W Unit B-2
- 572 S 100 W Unit E 210
- 64 W 600 S Unit C301
- 64 W 600 S Unit C205
- 64 W 600 S Unit C206
- 67 W 600 S Unit B301
- 618 S 100 W Unit D102
Your Personal Tour Guide
Ask me questions while you tour the home.