Estimated Value: $117,000 - $158,000
2
Beds
1
Bath
1,078
Sq Ft
$130/Sq Ft
Est. Value
About This Home
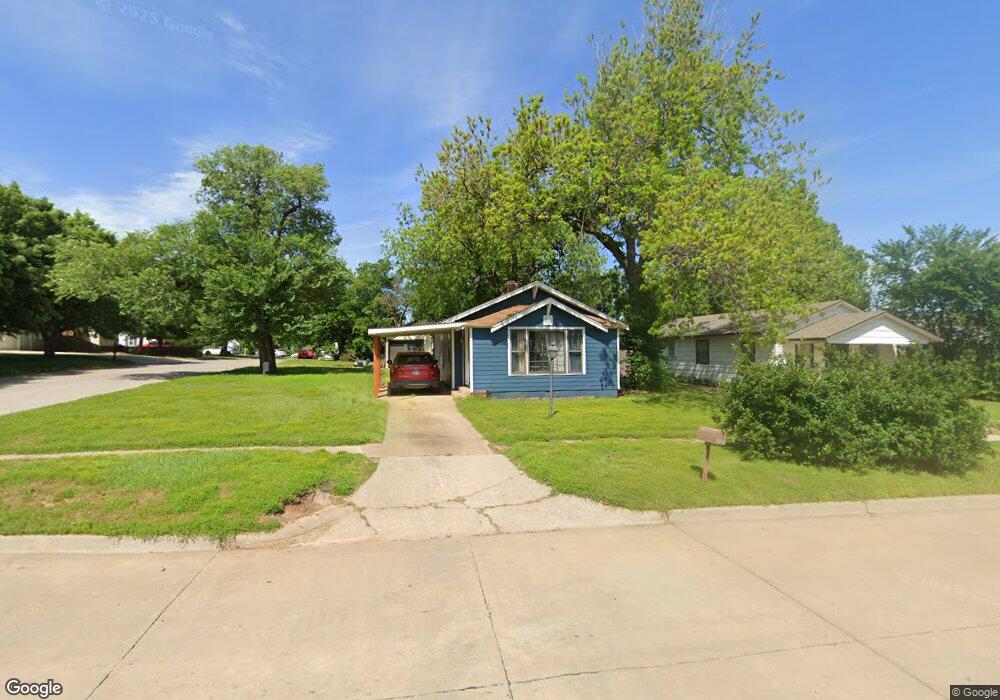
This home is located at 24 S 9th St, Yukon, OK 73099 and is currently estimated at $140,012, approximately $129 per square foot. 24 S 9th St is a home located in Canadian County with nearby schools including Central Elementary School, Independence Elementary School, and Yukon Middle School.
Ownership History
Date
Name
Owned For
Owner Type
Purchase Details
Closed on
Apr 25, 2012
Sold by
Gotcher Joshua Kyle and Gotcher Desiree
Bought by
Gotcher Joshua Kyle and Gotcher Desiree
Current Estimated Value
Purchase Details
Closed on
Mar 19, 2007
Sold by
Jackson Alphonso
Bought by
Gotcher Joshua Kyle
Home Financials for this Owner
Home Financials are based on the most recent Mortgage that was taken out on this home.
Original Mortgage
$55,493
Outstanding Balance
$33,589
Interest Rate
6.26%
Estimated Equity
$106,423
Purchase Details
Closed on
Apr 19, 2006
Sold by
Davis Patricia G
Bought by
Sectretary Of Hud
Purchase Details
Closed on
Sep 27, 2001
Sold by
Fowler Karen L
Purchase Details
Closed on
Sep 28, 1999
Sold by
Haney Bell Charles
Purchase Details
Closed on
May 12, 1997
Sold by
Roger Despain & Co Llc
Purchase Details
Closed on
Dec 6, 1996
Sold by
Boyd Charles Trustee*
Purchase Details
Closed on
Aug 8, 1989
Create a Home Valuation Report for This Property
The Home Valuation Report is an in-depth analysis detailing your home's value as well as a comparison with similar homes in the area
Home Values in the Area
Average Home Value in this Area
Purchase History
| Date | Buyer | Sale Price | Title Company |
|---|---|---|---|
| Gotcher Joshua Kyle | -- | None Available | |
| Gotcher Joshua Kyle | -- | None Available | |
| Sectretary Of Hud | -- | None Available | |
| -- | $61,000 | -- | |
| -- | -- | -- | |
| -- | $55,000 | -- | |
| -- | $25,500 | -- | |
| -- | -- | -- |
Source: Public Records
Mortgage History
| Date | Status | Borrower | Loan Amount |
|---|---|---|---|
| Open | Gotcher Joshua Kyle | $55,493 |
Source: Public Records
Tax History Compared to Growth
Tax History
| Year | Tax Paid | Tax Assessment Tax Assessment Total Assessment is a certain percentage of the fair market value that is determined by local assessors to be the total taxable value of land and additions on the property. | Land | Improvement |
|---|---|---|---|---|
| 2024 | $734 | $7,118 | $1,653 | $5,465 |
| 2023 | $734 | $6,779 | $1,503 | $5,276 |
| 2022 | $703 | $6,457 | $1,337 | $5,120 |
| 2021 | $705 | $6,457 | $1,337 | $5,120 |
| 2020 | $696 | $6,457 | $1,337 | $5,120 |
| 2019 | $700 | $6,470 | $1,337 | $5,133 |
| 2018 | $669 | $6,162 | $1,337 | $4,825 |
| 2017 | $679 | $6,254 | $1,337 | $4,917 |
| 2016 | $669 | $6,161 | $1,337 | $4,824 |
| 2015 | $660 | $5,903 | $1,337 | $4,566 |
| 2014 | $660 | $5,987 | $1,337 | $4,650 |
Source: Public Records
Map
Nearby Homes
- 1004 Cedar Ave
- 1016 Maple Ave
- 1101 W Main St
- 417 Garth Brooks Blvd
- 600 S 8th St
- 601 S 8th St
- 11325 SW 34th Terrace
- 2117 Aminas Way
- 705 Yukon Ave
- 9116 Anaum Ln
- 2001 Aminas Way
- 11033 NW 20th Terrace
- 624 Frisco Ridge Rd
- 210 N 4th St
- 4601 Grassland Dr
- 621 Yukon Ave
- 11817 Corie Nicole Ln
- 502 Walnut Ave
- 3608 Northover Ridge Dr
- 3509 Sawtooth Ridge Dr