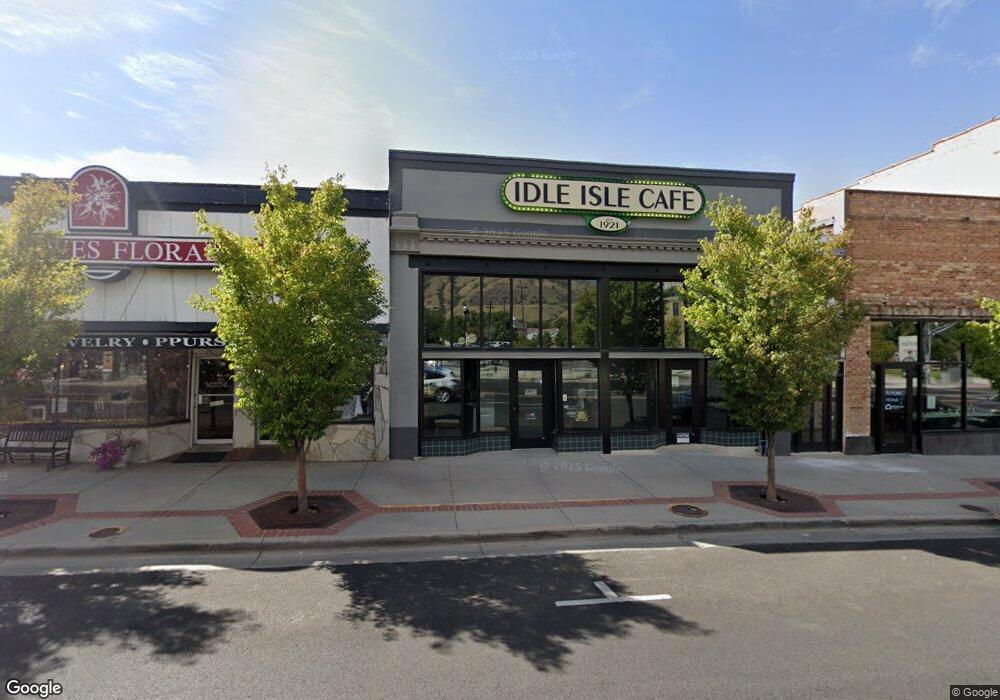
24 S Main St Brigham City, UT 84302
Estimated Value: $652,081
--
Bed
--
Bath
--
Sq Ft
4,792
Sq Ft Lot
About This Home
This home is located at 24 S Main St, Brigham City, UT 84302 and is currently estimated at $652,081. 24 S Main St is a home located in Box Elder County with nearby schools including Lake View Elementary School, Box Elder Middle School, and Adele C. Young Intermediate School.
Ownership History
Date
Name
Owned For
Owner Type
Purchase Details
Closed on
Jun 27, 2025
Sold by
Sugar Plum Holdings Bc Llc
Bought by
M4 Real Estate Llc
Current Estimated Value
Purchase Details
Closed on
Jun 23, 2015
Home Financials for this Owner
Home Financials are based on the most recent Mortgage that was taken out on this home.
Original Mortgage
$395,000
Interest Rate
3.83%
Mortgage Type
Commercial
Create a Home Valuation Report for This Property
The Home Valuation Report is an in-depth analysis detailing your home's value as well as a comparison with similar homes in the area
Home Values in the Area
Average Home Value in this Area
Purchase History
| Date | Buyer | Sale Price | Title Company |
|---|---|---|---|
| M4 Real Estate Llc | -- | Old Republic Title | |
| M4 Real Estate Llc | -- | Old Republic Title | |
| -- | $395,000 | None Available | |
| T & J Porter Enterprises Inc | -- | Phillips Hansen Land Title C | |
| Jeppsen Kim H | -- | Phillips Hansen Land Title C |
Source: Public Records
Mortgage History
| Date | Status | Borrower | Loan Amount |
|---|---|---|---|
| Previous Owner | T & J Porter Enterprises Inc | $395,000 |
Source: Public Records
Tax History Compared to Growth
Tax History
| Year | Tax Paid | Tax Assessment Tax Assessment Total Assessment is a certain percentage of the fair market value that is determined by local assessors to be the total taxable value of land and additions on the property. | Land | Improvement |
|---|---|---|---|---|
| 2025 | $2,746 | $316,969 | $28,746 | $288,223 |
| 2024 | $2,746 | $290,767 | $28,746 | $262,021 |
| 2023 | $2,682 | $290,767 | $28,746 | $262,021 |
| 2022 | $2,259 | $227,637 | $19,166 | $208,471 |
| 2021 | $2,480 | $227,637 | $19,166 | $208,471 |
| 2020 | $2,547 | $227,637 | $19,166 | $208,471 |
| 2019 | $2,633 | $227,637 | $19,166 | $208,471 |
| 2018 | $2,648 | $227,637 | $19,166 | $208,471 |
| 2017 | $2,291 | $187,502 | $24,102 | $163,400 |
| 2016 | $2,492 | $187,500 | $24,100 | $163,400 |
Source: Public Records
Map
Nearby Homes