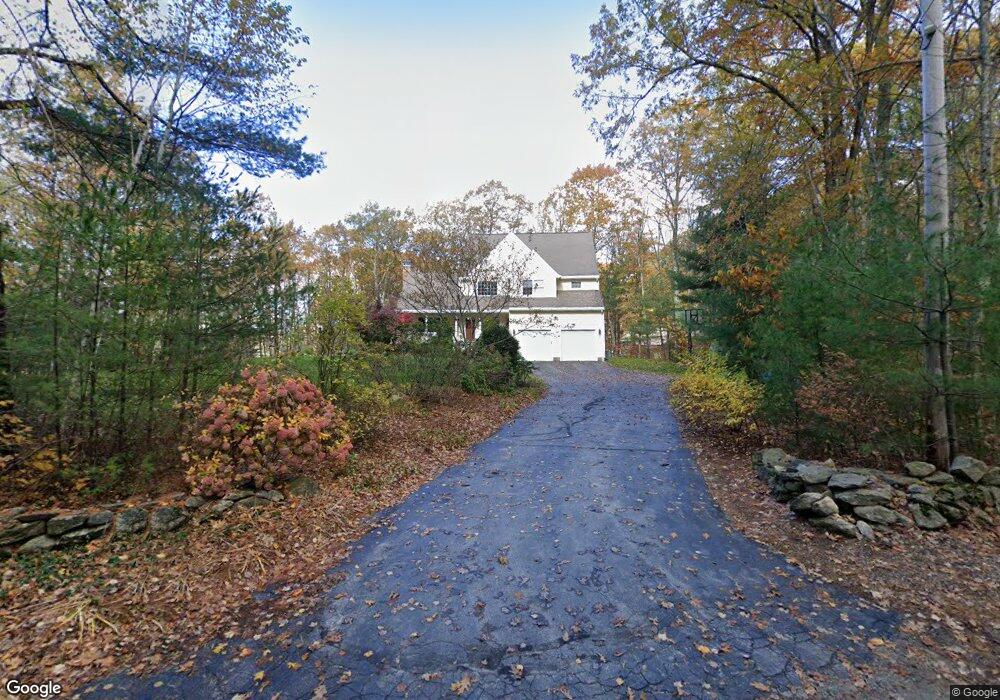
24 Sassawanna Rd Rutland, MA 01543
Estimated Value: $682,000 - $777,000
4
Beds
3
Baths
3,184
Sq Ft
$229/Sq Ft
Est. Value
About This Home
This home is located at 24 Sassawanna Rd, Rutland, MA 01543 and is currently estimated at $729,546, approximately $229 per square foot. 24 Sassawanna Rd is a home located in Worcester County with nearby schools including Wachusett Regional High School.
Ownership History
Date
Name
Owned For
Owner Type
Purchase Details
Closed on
Nov 29, 2006
Sold by
Cunningham Colleen and Cunningham Mark R
Bought by
Francis Michael M and Lemons Michele L
Current Estimated Value
Home Financials for this Owner
Home Financials are based on the most recent Mortgage that was taken out on this home.
Original Mortgage
$270,000
Interest Rate
6.36%
Mortgage Type
Purchase Money Mortgage
Purchase Details
Closed on
Jul 19, 2002
Sold by
Casebolt James R and Casebolt Susie A
Bought by
Cunningham Mark R and Cunningham Colleen
Purchase Details
Closed on
Aug 16, 2001
Sold by
Maykel Albert E and Maykel Magdelina
Bought by
Casebolt James R and Casebolt Susan A
Purchase Details
Closed on
Sep 28, 1990
Sold by
Pistorino Peter
Bought by
Cunningham Mark R
Create a Home Valuation Report for This Property
The Home Valuation Report is an in-depth analysis detailing your home's value as well as a comparison with similar homes in the area
Home Values in the Area
Average Home Value in this Area
Purchase History
| Date | Buyer | Sale Price | Title Company |
|---|---|---|---|
| Francis Michael M | $409,000 | -- | |
| Cunningham Mark R | $379,900 | -- | |
| Casebolt James R | $342,500 | -- | |
| Cunningham Mark R | $30,000 | -- |
Source: Public Records
Mortgage History
| Date | Status | Borrower | Loan Amount |
|---|---|---|---|
| Open | Cunningham Mark R | $257,810 | |
| Closed | Francis Michael M | $270,000 | |
| Previous Owner | Cunningham Mark R | $308,000 | |
| Previous Owner | Cunningham Mark R | $34,700 |
Source: Public Records
Tax History Compared to Growth
Tax History
| Year | Tax Paid | Tax Assessment Tax Assessment Total Assessment is a certain percentage of the fair market value that is determined by local assessors to be the total taxable value of land and additions on the property. | Land | Improvement |
|---|---|---|---|---|
| 2025 | $8,890 | $624,300 | $97,700 | $526,600 |
| 2024 | $8,874 | $598,400 | $93,800 | $504,600 |
| 2023 | $8,109 | $591,000 | $88,500 | $502,500 |
| 2022 | $7,593 | $480,900 | $74,800 | $406,100 |
| 2021 | $7,478 | $447,800 | $74,800 | $373,000 |
| 2020 | $7,373 | $418,700 | $71,000 | $347,700 |
| 2019 | $7,224 | $403,800 | $67,600 | $336,200 |
| 2018 | $6,911 | $381,200 | $67,600 | $313,600 |
| 2017 | $6,984 | $381,200 | $67,600 | $313,600 |
| 2016 | $6,538 | $376,400 | $64,300 | $312,100 |
| 2015 | $6,435 | $364,600 | $64,300 | $300,300 |
| 2014 | $6,238 | $364,600 | $64,300 | $300,300 |
Source: Public Records
Map
Nearby Homes
- 2 Simon Davis Dr
- 40 Brunelle Dr
- 35 Brintnal Dr
- 16 Richards Ave
- 73 Brintnal Dr
- 55 Pommogussett Rd
- 101 Brintnal Dr
- 5 Miles Rd
- 25 Watson Ln
- 32 Pommogussett Rd Unit 1
- 47 Woodside Ave
- 51 Woodside Ave
- 175 Glenwood Rd
- 10 Soucy Dr
- Lot 24R Quail Run
- Lot 29 Quail Run
- Lot 27A Quail Run
- 4 Fidelity Dr Unit 2
- 6 Fidelity Dr Unit 3
- 28 Forest Hill Dr
- 14 Sassawanna Rd
- 27 Sassawanna Rd
- 19 Sassawanna Rd
- 10 Sassawanna Rd
- 21 Sassawanna Rd
- 5 Rufus Putnam Place
- 8 Sassawanna Rd
- 17 Sassawanna Rd
- 7 Rufus Putnam Place
- 6 Sassawanna Rd
- 3 Rufus Putnam Place
- 6 Rufus Putnam Place
- 15 Sassawanna Rd
- 4 Sassawanna Rd
- 4 Rufus Putnam Place
- 1 Rufus Putnam Place
- 45 Sassawanna Rd
- 41 Sassawanna Rd
- 2 Rufus Putnam Place
- 5 Simon Davis Dr