Estimated Value: $2,193,457
Studio
--
Bath
9,255
Sq Ft
$237/Sq Ft
Est. Value
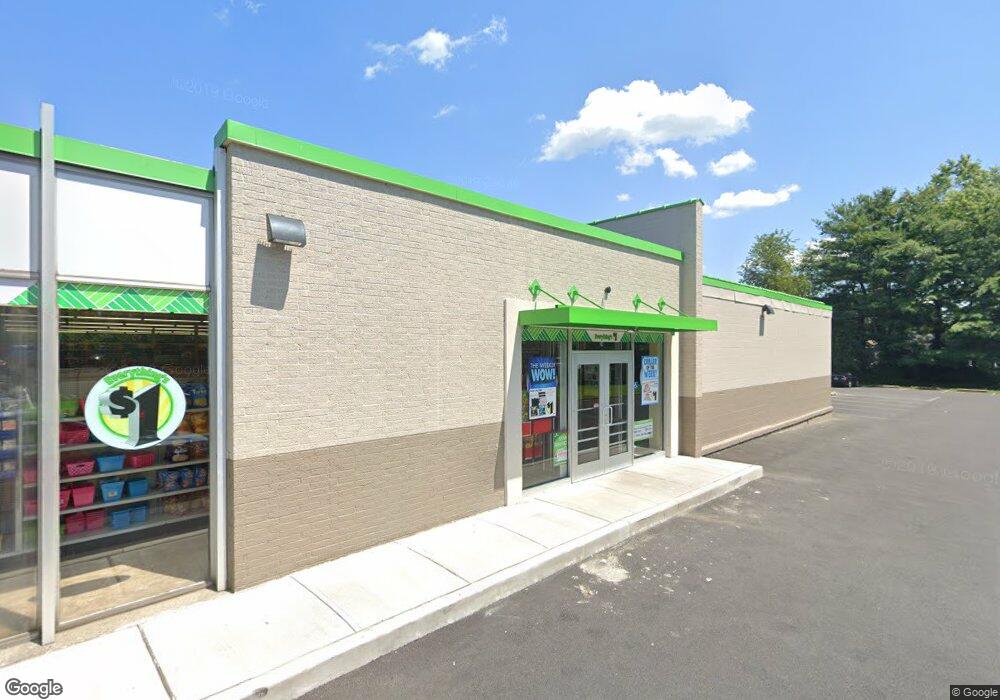
About This Home
This home is located at 24 Scotch Rd, Ewing, NJ 08628 and is currently estimated at $2,193,457, approximately $237 per square foot. 24 Scotch Rd is a home located in Mercer County with nearby schools including Ewing High School, The Village Charter School, and Trenton Stem-To-Civics Charter School.
Ownership History
Date
Name
Owned For
Owner Type
Purchase Details
Closed on
Jun 1, 2021
Sold by
24 Scotch Rd Llc
Bought by
Ds Exchangeright Net Leased Portfolio 47
Current Estimated Value
Purchase Details
Closed on
Apr 30, 2018
Sold by
Scotch Properties Llc
Bought by
24 Scotch Rd Llc
Purchase Details
Closed on
Nov 10, 2011
Sold by
Palmer Anne L and Aronson Franklyn Z
Bought by
Scotch Properties Llc
Home Financials for this Owner
Home Financials are based on the most recent Mortgage that was taken out on this home.
Original Mortgage
$510,000
Interest Rate
4.01%
Mortgage Type
Commercial
Create a Home Valuation Report for This Property
The Home Valuation Report is an in-depth analysis detailing your home's value as well as a comparison with similar homes in the area
Home Values in the Area
Average Home Value in this Area
Purchase History
| Date | Buyer | Sale Price | Title Company |
|---|---|---|---|
| Ds Exchangeright Net Leased Portfolio 47 | $1,536,000 | Chicago Title Company Llc | |
| 24 Scotch Rd Llc | $875,000 | Madison Title Agency Llc | |
| Scotch Properties Llc | $680,000 | First American Title Ins Co |
Source: Public Records
Mortgage History
| Date | Status | Borrower | Loan Amount |
|---|---|---|---|
| Previous Owner | Scotch Properties Llc | $510,000 |
Source: Public Records
Tax History
| Year | Tax Paid | Tax Assessment Tax Assessment Total Assessment is a certain percentage of the fair market value that is determined by local assessors to be the total taxable value of land and additions on the property. | Land | Improvement |
|---|---|---|---|---|
| 2025 | $33,344 | $847,800 | $168,000 | $679,800 |
| 2024 | $31,343 | $847,800 | $168,000 | $679,800 |
| 2023 | $31,343 | $847,800 | $168,000 | $679,800 |
| 2022 | $30,495 | $847,800 | $168,000 | $679,800 |
| 2021 | $29,749 | $847,800 | $168,000 | $679,800 |
| 2020 | $29,325 | $847,800 | $168,000 | $679,800 |
| 2019 | $28,562 | $847,800 | $168,000 | $679,800 |
| 2018 | $24,297 | $460,000 | $126,000 | $334,000 |
| 2017 | $24,863 | $460,000 | $126,000 | $334,000 |
| 2016 | $24,527 | $460,000 | $126,000 | $334,000 |
| 2015 | $24,201 | $460,000 | $126,000 | $334,000 |
| 2014 | $24,136 | $460,000 | $126,000 | $334,000 |
Source: Public Records
Map
Nearby Homes
- 1205 Parkway Ave
- 1183 Lower Ferry Rd
- 1103 Parkway Ave
- 1060 Terrace Blvd
- 288 Clamer Rd
- 1247 Lower Ferry Rd
- 33 Stratford Ave
- 16 Kyle Way Unit 211
- 18 Kyle Way
- 59 Kyle Way
- 1200 Silvia St
- 224 Clamer Rd
- 385 Silvia St
- 335 Silvia St
- 341 Silvia St
- 322 Wynnewood Rd
- 41 Harding St
- 152 Franklyn Rd
- 13 Decou Ave
- 1005 Terrace Blvd
Your Personal Tour Guide
Ask me questions while you tour the home.