Estimated Value: $333,755 - $377,000
--
Bed
--
Bath
2,213
Sq Ft
$163/Sq Ft
Est. Value
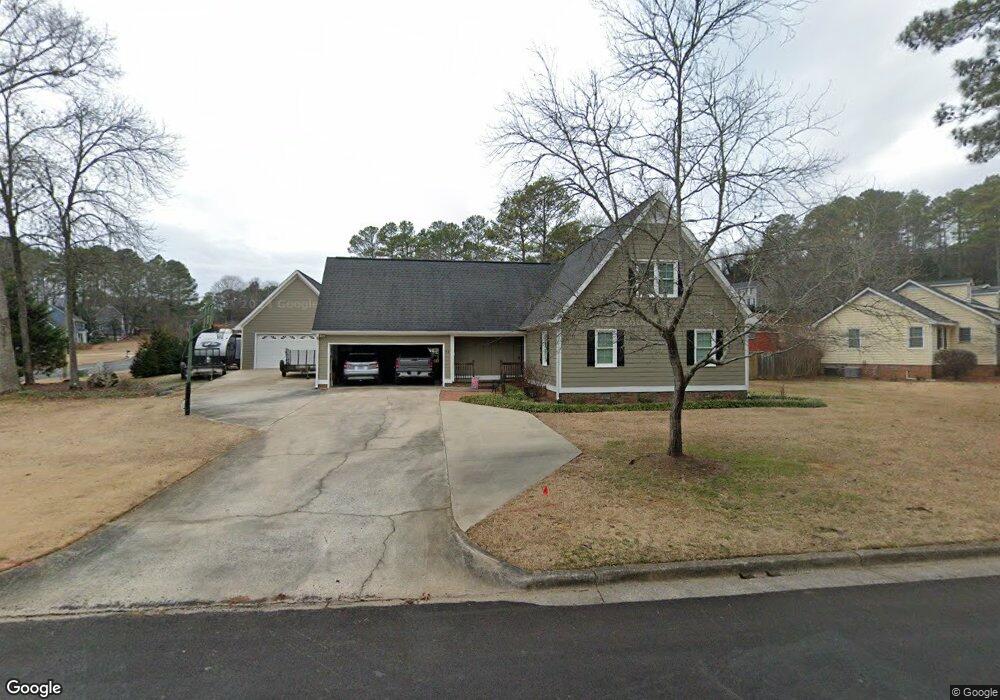
About This Home
This home is located at 24 Shadowood Dr SE, Rome, GA 30161 and is currently estimated at $360,439, approximately $162 per square foot. 24 Shadowood Dr SE is a home located in Floyd County with nearby schools including Rome High School, St. Mary School, and Darlington School.
Ownership History
Date
Name
Owned For
Owner Type
Purchase Details
Closed on
Aug 8, 1996
Sold by
Carnes Joy T and Carnes Larry D
Bought by
Bethune Tony and Tracie Bethune
Current Estimated Value
Purchase Details
Closed on
Feb 23, 1996
Sold by
Carnes Joy T
Bought by
Carnes Joy T and Carnes Larry D
Purchase Details
Closed on
Feb 20, 1996
Sold by
Howell Joy T and Howell William T
Bought by
Carnes Joy T
Purchase Details
Closed on
Apr 1, 1987
Sold by
Larry Alexander H and Larry Hansard
Bought by
Howell Joy T and Howell William T
Purchase Details
Closed on
Jun 15, 1983
Sold by
Alexander & Hansard Inc
Bought by
Larry Alexander H and Larry Hansa
Purchase Details
Closed on
Feb 12, 1980
Sold by
Munchak Theodore J
Bought by
Alexander & Hansard Inc
Purchase Details
Closed on
Dec 31, 1979
Sold by
Prestige Parks Inc
Bought by
Munchak Theodore J
Purchase Details
Closed on
Oct 31, 1975
Bought by
Prestige Parks Inc
Create a Home Valuation Report for This Property
The Home Valuation Report is an in-depth analysis detailing your home's value as well as a comparison with similar homes in the area
Home Values in the Area
Average Home Value in this Area
Purchase History
| Date | Buyer | Sale Price | Title Company |
|---|---|---|---|
| Bethune Tony | $123,900 | -- | |
| Carnes Joy T | -- | -- | |
| Carnes Joy T | -- | -- | |
| Howell Joy T | $88,000 | -- | |
| Larry Alexander H | $44,100 | -- | |
| Alexander & Hansard Inc | -- | -- | |
| Munchak Theodore J | -- | -- | |
| Prestige Parks Inc | -- | -- |
Source: Public Records
Tax History Compared to Growth
Tax History
| Year | Tax Paid | Tax Assessment Tax Assessment Total Assessment is a certain percentage of the fair market value that is determined by local assessors to be the total taxable value of land and additions on the property. | Land | Improvement |
|---|---|---|---|---|
| 2024 | $3,296 | $128,801 | $21,151 | $107,650 |
| 2023 | $2,638 | $128,100 | $18,801 | $109,299 |
| 2022 | $3,043 | $108,588 | $15,276 | $93,312 |
| 2021 | $2,698 | $86,277 | $15,276 | $71,001 |
| 2020 | $2,609 | $80,052 | $11,750 | $68,302 |
| 2019 | $2,538 | $77,246 | $11,750 | $65,496 |
| 2018 | $2,504 | $75,224 | $11,750 | $63,474 |
| 2017 | $2,447 | $71,874 | $11,750 | $60,124 |
| 2016 | $2,444 | $71,228 | $11,720 | $59,508 |
| 2015 | $2,398 | $71,948 | $11,720 | $60,228 |
| 2014 | $2,398 | $75,779 | $11,720 | $64,059 |
Source: Public Records
Map
Nearby Homes
- 9 Heather Rd SE
- 100 Valley Brook Dr SE
- 20 Mitchell Cir SE
- 4 Mitchell Cir SE
- 120 Keown Rd SE
- 14 Laurchris Dr SE
- 6 Woodland Dr SE
- 0 Lakeshore Dr
- 26 Maplewood Square SE
- 22 Oakfield Dr SE
- 227 W Lakeshore Dr SE
- 11 Breckenridge Rd SE
- 13 Breckenridge Rd SE
- 0 Georgia 293
- 226 Maplecrest Ln SE
- 11 Surrey Trail SE
- 36 Busby Dr SE
- 38 Busby Dr SE
- 4 Coach Trail SE
- 11 Valley Brook Dr SE
- 22 Shadowood Dr SE
- 20 Shadowood Dr SE
- 9 Valley Brook Dr SE
- 18 Shadowood Dr SE
- 0 Shadowood Dr NE Unit 3025392
- 0 Shadowood Dr NE
- 10 Valley Brook Dr SE
- 23 Shadowood Dr SE
- 25 Shadowood Dr SE
- 7 Valley Brook Dr SE
- 16 Shadowood Dr SE
- 27 Shadowood Dr SE
- 1 Heather Rd SE
- 21 Shadowood Dr SE
- 0 Shadowood Dr SE Unit 20015739
- 0 Shadowood Dr SE Unit 7329128
- 0 Shadowood Dr SE Unit 7272122
- 0 Shadowood Dr SE Unit 8658036
- 0 Shadowood Dr SE Unit 8460418