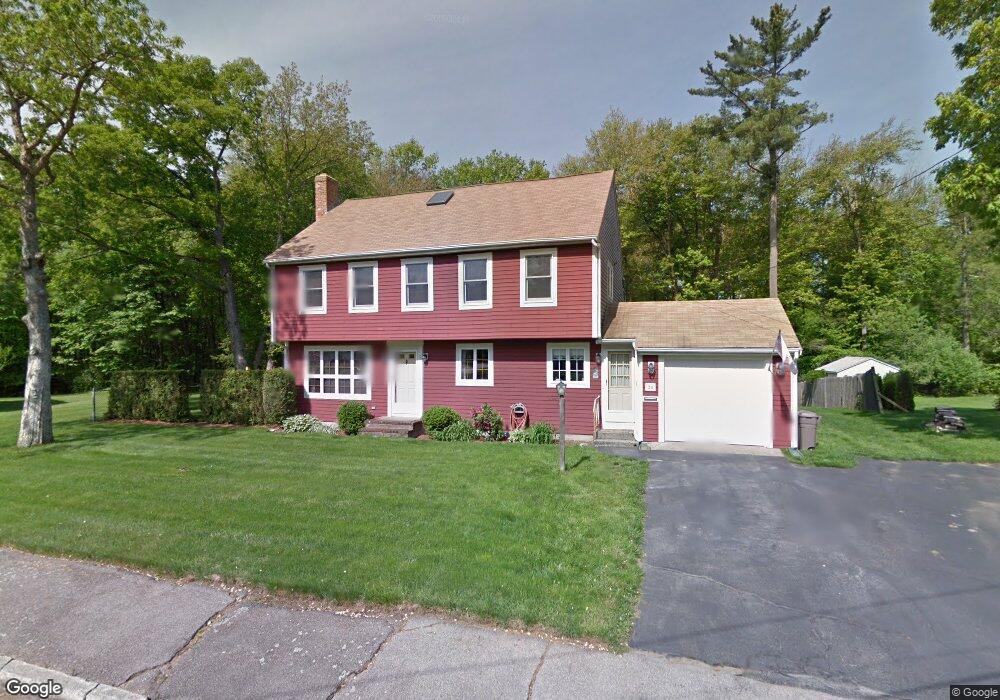
24 Shady Ln South Weymouth, MA 02190
South Weymouth NeighborhoodEstimated Value: $733,319 - $924,000
4
Beds
4
Baths
1,828
Sq Ft
$444/Sq Ft
Est. Value
About This Home
This home is located at 24 Shady Ln, South Weymouth, MA 02190 and is currently estimated at $810,830, approximately $443 per square foot. 24 Shady Ln is a home located in Norfolk County with nearby schools including Thomas V Nash, Abigail Adams Middle School, and Weymouth Middle School Chapman.
Ownership History
Date
Name
Owned For
Owner Type
Purchase Details
Closed on
Nov 21, 2003
Sold by
Lane Michael P and Lane Denise A
Bought by
Leahy James F
Current Estimated Value
Home Financials for this Owner
Home Financials are based on the most recent Mortgage that was taken out on this home.
Original Mortgage
$240,000
Outstanding Balance
$111,110
Interest Rate
5.98%
Mortgage Type
Purchase Money Mortgage
Estimated Equity
$699,720
Create a Home Valuation Report for This Property
The Home Valuation Report is an in-depth analysis detailing your home's value as well as a comparison with similar homes in the area
Home Values in the Area
Average Home Value in this Area
Purchase History
| Date | Buyer | Sale Price | Title Company |
|---|---|---|---|
| Leahy James F | $450,000 | -- |
Source: Public Records
Mortgage History
| Date | Status | Borrower | Loan Amount |
|---|---|---|---|
| Open | Leahy James F | $240,000 | |
| Previous Owner | Leahy James F | $203,397 |
Source: Public Records
Tax History Compared to Growth
Tax History
| Year | Tax Paid | Tax Assessment Tax Assessment Total Assessment is a certain percentage of the fair market value that is determined by local assessors to be the total taxable value of land and additions on the property. | Land | Improvement |
|---|---|---|---|---|
| 2025 | $6,193 | $613,200 | $231,000 | $382,200 |
| 2024 | $6,580 | $640,700 | $220,000 | $420,700 |
| 2023 | $6,460 | $618,200 | $222,200 | $396,000 |
| 2022 | $6,279 | $547,900 | $205,800 | $342,100 |
| 2021 | $6,025 | $513,200 | $205,800 | $307,400 |
| 2020 | $5,776 | $484,600 | $205,800 | $278,800 |
| 2019 | $5,679 | $468,600 | $197,800 | $270,800 |
| 2018 | $5,495 | $439,600 | $188,400 | $251,200 |
| 2017 | $5,410 | $422,300 | $179,500 | $242,800 |
| 2016 | $5,199 | $406,200 | $172,600 | $233,600 |
| 2015 | $5,010 | $388,400 | $172,600 | $215,800 |
| 2014 | $4,711 | $354,200 | $153,900 | $200,300 |
Source: Public Records
Map
Nearby Homes
- 24 Fisher Rd
- 68 Massapoag St Unit 7
- 16 Jay Rd
- 211 Randolph St
- 193 Randolph St
- 308 Forest St
- 92 Mercury St
- 134 Tyson Commons Ln
- 20 Wilbur St
- 262 West St
- 27 Park Ave
- 255 West St
- 18 Fountain Ln Unit 2
- 2 Mitchell Ln Unit B
- 60 Greentree Ln Unit 38
- 11 Woodcrest Ct Unit 5
- 10 Woodcrest Ct Unit 4
- 55 Greentree Ln Unit 19
- 7 Woodcrest Ct Unit 4
- 17 Berean Way