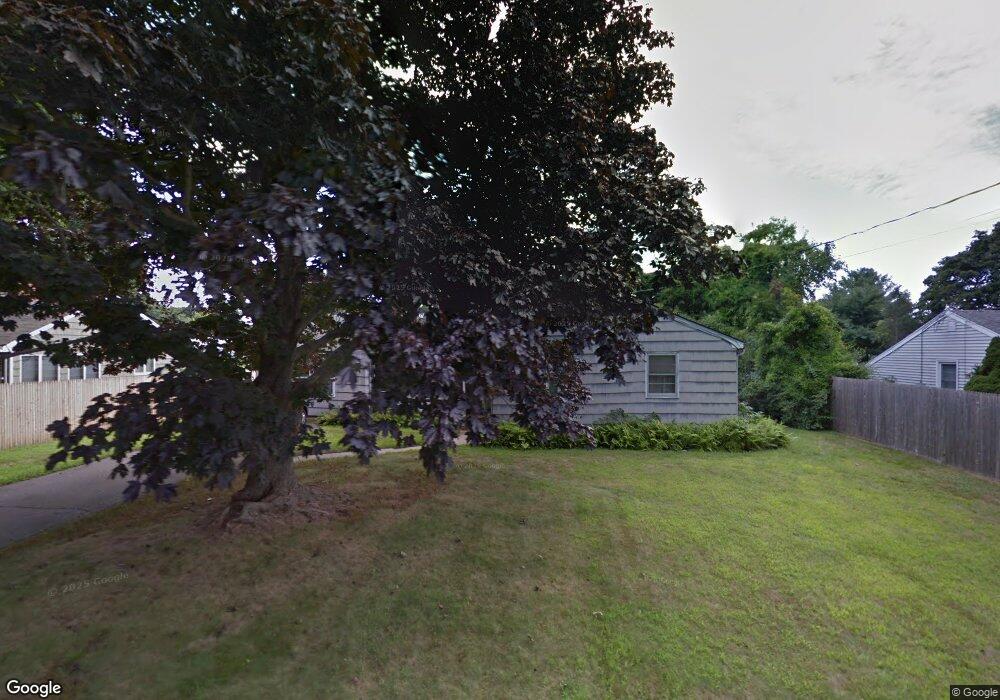
24 Shepard St Old Saybrook, CT 06475
Estimated Value: $551,292 - $586,000
3
Beds
1
Bath
1,434
Sq Ft
$396/Sq Ft
Est. Value
About This Home
This home is located at 24 Shepard St, Old Saybrook, CT 06475 and is currently estimated at $567,823, approximately $395 per square foot. 24 Shepard St is a home located in Middlesex County with nearby schools including Kathleen E. Goodwin School, Old Saybrook Middle School, and Old Saybrook Senior High School.
Ownership History
Date
Name
Owned For
Owner Type
Purchase Details
Closed on
Nov 9, 2023
Sold by
Lindgren Joan A
Bought by
Irlbeck Patrick J and Macdonald Scott T
Current Estimated Value
Home Financials for this Owner
Home Financials are based on the most recent Mortgage that was taken out on this home.
Original Mortgage
$384,000
Outstanding Balance
$377,054
Interest Rate
7.31%
Mortgage Type
Purchase Money Mortgage
Estimated Equity
$190,769
Purchase Details
Closed on
Mar 21, 1966
Bought by
Lindgren Roy G
Create a Home Valuation Report for This Property
The Home Valuation Report is an in-depth analysis detailing your home's value as well as a comparison with similar homes in the area
Home Values in the Area
Average Home Value in this Area
Purchase History
| Date | Buyer | Sale Price | Title Company |
|---|---|---|---|
| Irlbeck Patrick J | $480,000 | None Available | |
| Lindgren Roy G | -- | -- |
Source: Public Records
Mortgage History
| Date | Status | Borrower | Loan Amount |
|---|---|---|---|
| Open | Irlbeck Patrick J | $384,000 |
Source: Public Records
Tax History Compared to Growth
Tax History
| Year | Tax Paid | Tax Assessment Tax Assessment Total Assessment is a certain percentage of the fair market value that is determined by local assessors to be the total taxable value of land and additions on the property. | Land | Improvement |
|---|---|---|---|---|
| 2025 | $4,388 | $283,100 | $114,100 | $169,000 |
| 2024 | $3,982 | $262,000 | $114,100 | $147,900 |
| 2023 | $3,969 | $194,000 | $89,900 | $104,100 |
| 2022 | $3,896 | $194,000 | $89,900 | $104,100 |
| 2021 | $3,890 | $194,000 | $89,900 | $104,100 |
| 2020 | $3,892 | $194,100 | $90,000 | $104,100 |
| 2019 | $3,833 | $194,100 | $90,000 | $104,100 |
| 2018 | $3,855 | $196,700 | $90,000 | $106,700 |
| 2017 | $3,867 | $196,700 | $90,000 | $106,700 |
| 2016 | $3,788 | $196,700 | $90,000 | $106,700 |
| 2015 | $3,700 | $196,700 | $90,000 | $106,700 |
| 2014 | $3,639 | $196,700 | $90,000 | $106,700 |
Source: Public Records
Map
Nearby Homes