Estimated Value: $817,421 - $924,000
4
Beds
3
Baths
2,080
Sq Ft
$420/Sq Ft
Est. Value
About This Home
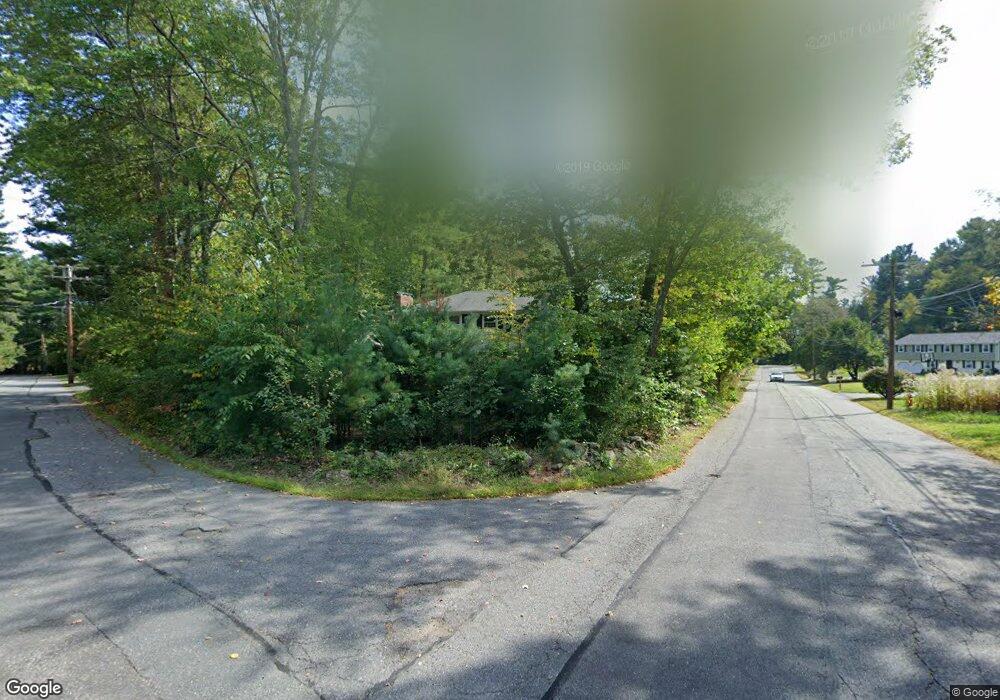
This home is located at 24 Smart Rd, Acton, MA 01720 and is currently estimated at $872,605, approximately $419 per square foot. 24 Smart Rd is a home located in Middlesex County with nearby schools including Acton-Boxborough Regional High School.
Ownership History
Date
Name
Owned For
Owner Type
Purchase Details
Closed on
Jan 21, 2022
Sold by
Callahan Michael T and Callahan Kristen E
Bought by
M & K Callahan Lt
Current Estimated Value
Purchase Details
Closed on
Apr 16, 2021
Sold by
Trimble Ronald R and Robarge Sherry P
Bought by
Callahan Michael T and Callahan Kristen E
Home Financials for this Owner
Home Financials are based on the most recent Mortgage that was taken out on this home.
Original Mortgage
$611,100
Interest Rate
3%
Mortgage Type
Purchase Money Mortgage
Purchase Details
Closed on
Oct 29, 2002
Sold by
Munroe John P and Munroe Nancy Ellen
Bought by
Robarge Sherry P and Trimble Ronald R
Home Financials for this Owner
Home Financials are based on the most recent Mortgage that was taken out on this home.
Original Mortgage
$377,600
Interest Rate
6.2%
Mortgage Type
Purchase Money Mortgage
Purchase Details
Closed on
Oct 20, 1993
Sold by
Munroe Alice B
Bought by
Munroe John P and Munroe Nancy E
Create a Home Valuation Report for This Property
The Home Valuation Report is an in-depth analysis detailing your home's value as well as a comparison with similar homes in the area
Home Values in the Area
Average Home Value in this Area
Purchase History
| Date | Buyer | Sale Price | Title Company |
|---|---|---|---|
| M & K Callahan Lt | -- | None Available | |
| Callahan Michael T | $679,000 | None Available | |
| Robarge Sherry P | $472,000 | -- | |
| Munroe John P | $120,000 | -- |
Source: Public Records
Mortgage History
| Date | Status | Borrower | Loan Amount |
|---|---|---|---|
| Previous Owner | Callahan Michael T | $611,100 | |
| Previous Owner | Robarge Sherry P | $377,600 | |
| Previous Owner | Munroe John P | $250,000 | |
| Previous Owner | Munroe John P | $30,000 | |
| Previous Owner | Munroe John P | $201,500 |
Source: Public Records
Tax History
| Year | Tax Paid | Tax Assessment Tax Assessment Total Assessment is a certain percentage of the fair market value that is determined by local assessors to be the total taxable value of land and additions on the property. | Land | Improvement |
|---|---|---|---|---|
| 2025 | $12,055 | $702,900 | $340,800 | $362,100 |
| 2024 | $11,342 | $680,400 | $340,800 | $339,600 |
| 2023 | $11,038 | $628,600 | $309,800 | $318,800 |
| 2022 | $10,610 | $545,500 | $269,200 | $276,300 |
| 2021 | $10,344 | $511,300 | $249,200 | $262,100 |
| 2020 | $9,770 | $507,800 | $249,200 | $258,600 |
| 2019 | $9,480 | $489,400 | $249,200 | $240,200 |
| 2018 | $9,343 | $482,100 | $249,200 | $232,900 |
| 2017 | $9,118 | $478,400 | $249,200 | $229,200 |
| 2016 | $8,990 | $467,500 | $249,200 | $218,300 |
| 2015 | $9,146 | $480,100 | $249,200 | $230,900 |
| 2014 | $8,918 | $458,500 | $249,200 | $209,300 |
Source: Public Records
Map
Nearby Homes
- 90 Willow St Unit 1
- 92 Willow St Unit 3
- 92 Willow St Unit 2
- 280 W Acton Rd
- 247 W Acton Rd
- 235 Arlington St
- 40 Fifers Ln
- 184 Main St Unit 3
- 20 Joseph Reed Ln
- 17 W View Ln Unit 17
- 131 Main St
- 129 Main St Unit 129
- 12 S Acton Rd
- 25 Nylander Way
- 246 Main St Unit 2
- 30-6 Taylor Rd
- 7 Kelley Rd
- 77 Wheeler Dr Unit 77
- 5 Perkins Ln
- 20 Lyons Ln Unit 20
Your Personal Tour Guide
Ask me questions while you tour the home.