


24 Smith St Quincy, MA 02169
South Quincy Neighborhood
2
Beds
1
Bath
1,000
Sq Ft
4,661
Sq Ft Lot
About This Home
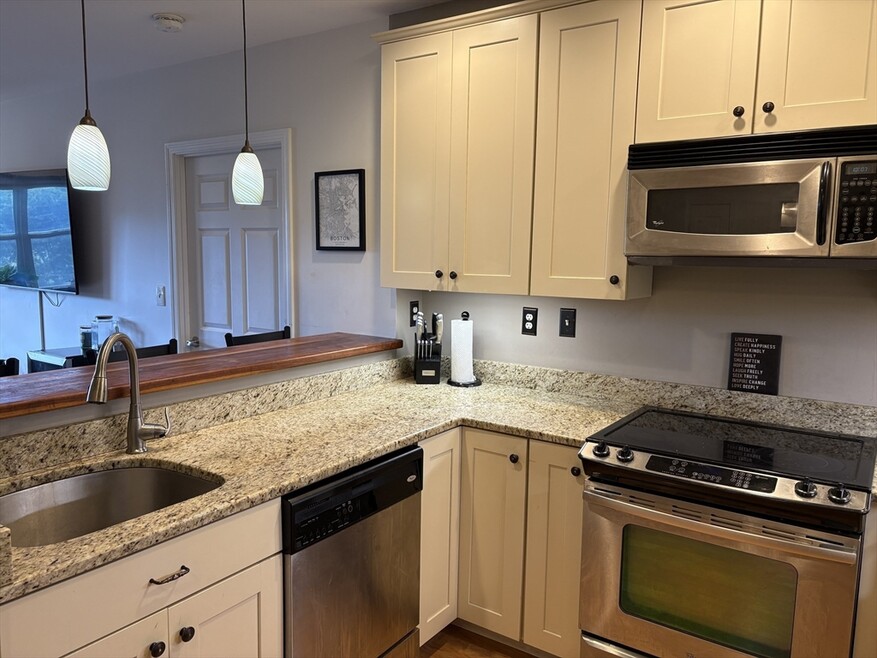
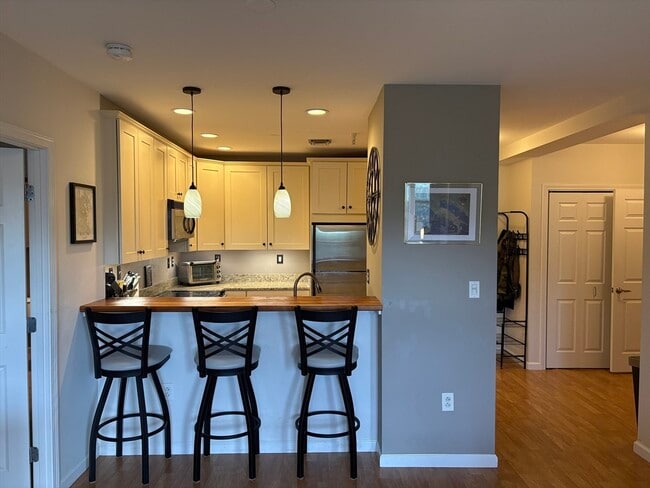
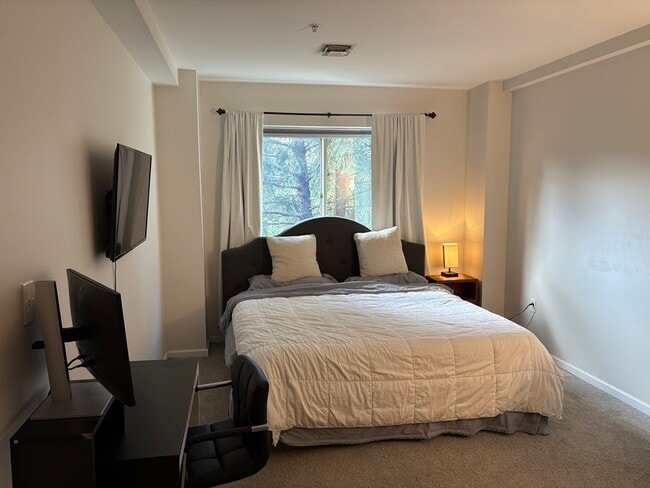
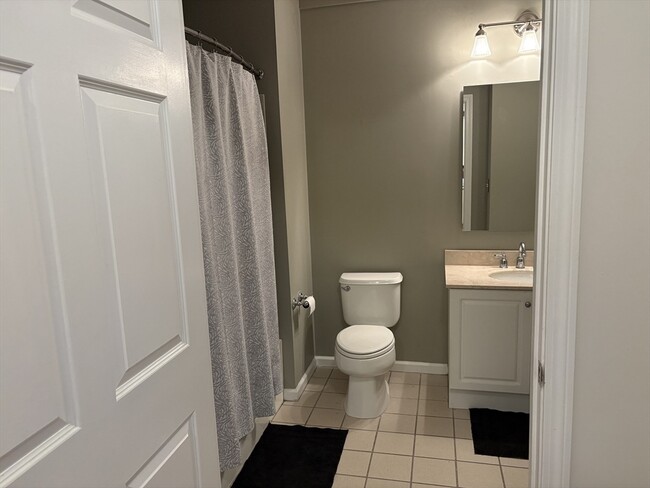
Spacious + modern 2-bedroom 1 bathroom apartment. This unit offers an open floor plan with large entryway and abundant storage. The kitchen features granite countertops, upgraded cabinetry, stainless steel appliances, and a custom wood breakfast bar—perfect for both everyday living and entertaining. Both bedrooms are generously sized, one with its own private bath and walk in closet . The unit also includes in-unit washer and dryer, making laundry a breeze. Includes two off street assigned parking spots, cold water, and sewer.
Listing Provided By

Map
Property History
| Date | Event | Price | List to Sale | Price per Sq Ft |
|---|---|---|---|---|
| 10/02/2025 10/02/25 | For Rent | $2,750 | -- | -- |
Nearby Homes
- 12 Nelson St
- 14 Arthur Ave
- 46 Suomi Rd Unit 46
- 46 Suomi Rd
- 21 Arthur St
- 91 Garfield St
- 64 Garfield St Unit B
- 57 Buckley St
- 1 Cityview Ln Unit 506
- 1 Cityview Ln Unit 709
- 25 McDonald St
- 211 Copeland St
- 28 Brook Rd
- 9 Westford St
- 8 Jackson St Unit B4
- 36 Village Dr
- 51 Branch St Unit 2
- 195 Thomas Burgin Pkwy Unit 212
- 459 Willard St Unit 303
- 87 Franklin St Unit 105
- 150 Quarry St Unit FL2-ID5438A
- 150 Quarry St Unit FL1-ID1393A
- 150 Quarry St Unit FL6-ID1793A
- 150 Quarry St Unit FL7-ID1906A
- 24 Carlmark St Unit 24
- 14 Nelson St Unit 2
- 30 Nelson St Unit 1
- 1-3 Nelson St Unit 1
- 1 Nelson St Unit 1
- 18 Buckley St Unit 2
- 229 Quarry St
- 43 Quarry St Unit 2
- 11 Town Hill St Unit 2
- 229 Quarry St Unit 1-1519
- 229 Quarry St Unit FL1-ID2494A
- 229 Quarry St Unit FL3-ID5807A
- 229 Quarry St Unit FL4-ID4485A
- 229 Quarry St Unit FL4-ID5613A
- 229 Quarry St Unit 3-3318
- 229 Quarry St Unit FL4-ID3974A
Your Personal Tour Guide
Ask me questions while you tour the home.