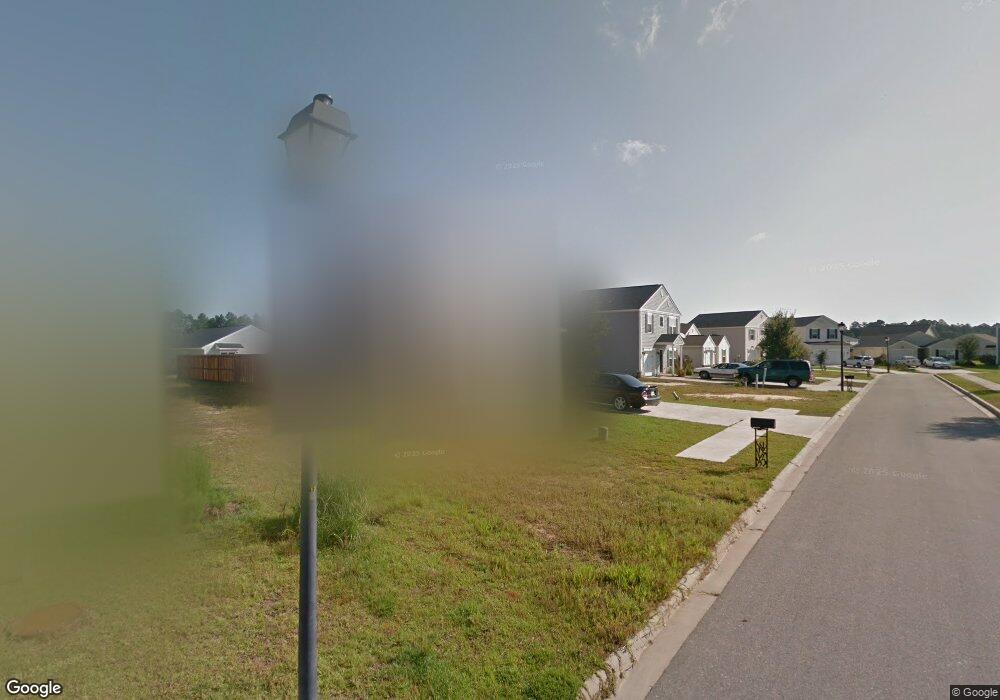
24 Spring Lakes Cir Pooler, GA 31322
Godley Station NeighborhoodEstimated Value: $293,836 - $321,000
3
Beds
3
Baths
1,580
Sq Ft
$195/Sq Ft
Est. Value
About This Home
This home is located at 24 Spring Lakes Cir, Pooler, GA 31322 and is currently estimated at $307,459, approximately $194 per square foot. 24 Spring Lakes Cir is a home located in Chatham County with nearby schools including Godley Station School, Groves High School, and Savannah Adventist Christian School.
Ownership History
Date
Name
Owned For
Owner Type
Purchase Details
Closed on
Oct 20, 2017
Sold by
Hyde Matthew Joseph
Bought by
Mccarty Kristy and Mccarty James
Current Estimated Value
Home Financials for this Owner
Home Financials are based on the most recent Mortgage that was taken out on this home.
Original Mortgage
$164,957
Outstanding Balance
$137,822
Interest Rate
3.83%
Mortgage Type
FHA
Estimated Equity
$169,637
Purchase Details
Closed on
Oct 23, 2013
Sold by
Landmark 24 Homes Of Georg
Bought by
Hyde Matthew Joseph
Home Financials for this Owner
Home Financials are based on the most recent Mortgage that was taken out on this home.
Original Mortgage
$161,488
Interest Rate
4.33%
Mortgage Type
VA
Purchase Details
Closed on
Feb 28, 2007
Sold by
Not Provided
Bought by
Srh Investments Llc and Hallmark Custom Homes
Create a Home Valuation Report for This Property
The Home Valuation Report is an in-depth analysis detailing your home's value as well as a comparison with similar homes in the area
Home Values in the Area
Average Home Value in this Area
Purchase History
| Date | Buyer | Sale Price | Title Company |
|---|---|---|---|
| Mccarty Kristy | $168,000 | -- | |
| Hyde Matthew Joseph | $156,330 | -- | |
| Srh Investments Llc | $1,516,000 | -- |
Source: Public Records
Mortgage History
| Date | Status | Borrower | Loan Amount |
|---|---|---|---|
| Open | Mccarty Kristy | $164,957 | |
| Previous Owner | Hyde Matthew Joseph | $161,488 |
Source: Public Records
Tax History
| Year | Tax Paid | Tax Assessment Tax Assessment Total Assessment is a certain percentage of the fair market value that is determined by local assessors to be the total taxable value of land and additions on the property. | Land | Improvement |
|---|---|---|---|---|
| 2025 | $1,907 | $112,240 | $19,400 | $92,840 |
| 2024 | $13 | $95,800 | $19,400 | $76,400 |
| 2023 | $689 | $98,920 | $19,400 | $79,520 |
| 2022 | $1,766 | $81,680 | $12,920 | $68,760 |
| 2021 | $2,583 | $71,440 | $12,920 | $58,520 |
| 2020 | $1,770 | $69,640 | $12,920 | $56,720 |
| 2019 | $2,580 | $66,360 | $12,920 | $53,440 |
| 2018 | $1,747 | $64,240 | $12,920 | $51,320 |
| 2017 | $1,777 | $60,600 | $12,920 | $47,680 |
| 2016 | $1,734 | $59,440 | $12,920 | $46,520 |
| 2015 | $2,502 | $60,000 | $12,920 | $47,080 |
| 2014 | $2,561 | $59,080 | $0 | $0 |
Source: Public Records
Map
Nearby Homes
- 6 Spring Lake Cir
- 2 Havasu Lake Dr
- 44 Winter Lake Cir
- 153 Greyfield Cir
- 16 Millwood Lake Dr
- 203 Lakepointe Dr
- 190 Willow Point Cir
- 171 Greyfield Cir
- 79 Crystal Lake Dr
- 225 Willow Point Cir
- 163 Willow Point Cir
- 218 Willow Point Ln
- 230 Willow Point Cir
- 158 Willow Point Cir
- 10 Hartland Ct
- 97 Crystal Lake Dr
- 123 Wind Willow Dr
- 143 Waverly Way
- 256 Lakepointe Dr
- 149 Willow Point Cir
- 24 Spring Lake Cir
- 24 Spring Lake Cir
- 26 Spring Lake Circle Dr
- 22 Spring Lake Cir
- 22 Spring Lake Dr
- 22 Spring Lakes Cir
- 28 Spring Lakes Cir
- 28 Spring Lake Cir
- 20 Spring Lakes Cir
- 20 Spring Lake Cir
- 30 Springlake Cir
- 18 Spring Lake Cir
- 18 Spring Lakes Cir
- 30 Spring Lakes Cir
- 149 Lakepointe Dr
- 149 Lakepointe Dr
- 151 Lakepointe Dr
- 151 Lakepointe Dr
- 153 Lakepointe Dr
- 147 Lakepointe Dr
Your Personal Tour Guide
Ask me questions while you tour the home.