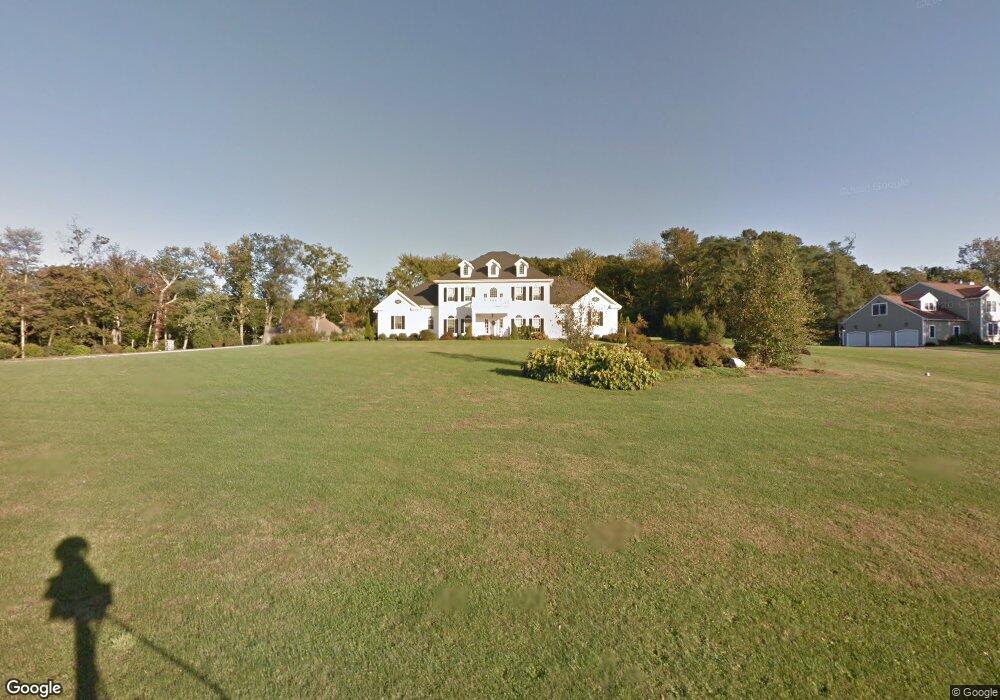
24 Stone Hedge Ct Harwinton, CT 06791
Estimated Value: $533,000 - $960,000
3
Beds
3
Baths
4,608
Sq Ft
$183/Sq Ft
Est. Value
About This Home
This home is located at 24 Stone Hedge Ct, Harwinton, CT 06791 and is currently estimated at $842,507, approximately $182 per square foot. 24 Stone Hedge Ct is a home located in Litchfield County with nearby schools including Harwinton Consolidated School, Har-Bur Middle School, and Lewis S. Mills High School.
Ownership History
Date
Name
Owned For
Owner Type
Purchase Details
Closed on
Nov 29, 2018
Sold by
Mcgrath Stephen and Mcgrath Kimberlie
Bought by
Vanczak Carol
Current Estimated Value
Home Financials for this Owner
Home Financials are based on the most recent Mortgage that was taken out on this home.
Original Mortgage
$403,260
Outstanding Balance
$267,421
Interest Rate
4.9%
Mortgage Type
Future Advance Clause Open End Mortgage
Estimated Equity
$575,086
Purchase Details
Closed on
Nov 27, 2018
Sold by
Vanczak Carol
Bought by
Mcgrath Stephen and Mcgrath Kimberlie
Home Financials for this Owner
Home Financials are based on the most recent Mortgage that was taken out on this home.
Original Mortgage
$403,260
Outstanding Balance
$267,421
Interest Rate
4.9%
Mortgage Type
Future Advance Clause Open End Mortgage
Estimated Equity
$575,086
Purchase Details
Closed on
Jun 21, 2005
Sold by
Maselli Anthony and Maselli Marie E
Bought by
Bonini Robert J and Vanczak Carol A
Create a Home Valuation Report for This Property
The Home Valuation Report is an in-depth analysis detailing your home's value as well as a comparison with similar homes in the area
Home Values in the Area
Average Home Value in this Area
Purchase History
| Date | Buyer | Sale Price | Title Company |
|---|---|---|---|
| Vanczak Carol | -- | -- | |
| Vanczak Carol | -- | -- | |
| Mcgrath Stephen | $207,740 | -- | |
| Mcgrath Stephen | $207,740 | -- | |
| Bonini Robert J | $174,900 | -- | |
| Bonini Robert J | $174,900 | -- |
Source: Public Records
Mortgage History
| Date | Status | Borrower | Loan Amount |
|---|---|---|---|
| Open | Bonini Robert J | $403,260 | |
| Closed | Bonini Robert J | $403,260 | |
| Previous Owner | Bonini Robert J | $417,000 |
Source: Public Records
Tax History Compared to Growth
Tax History
| Year | Tax Paid | Tax Assessment Tax Assessment Total Assessment is a certain percentage of the fair market value that is determined by local assessors to be the total taxable value of land and additions on the property. | Land | Improvement |
|---|---|---|---|---|
| 2025 | $12,992 | $564,880 | $84,710 | $480,170 |
| 2024 | $12,936 | $564,880 | $84,710 | $480,170 |
| 2023 | $11,849 | $405,780 | $58,250 | $347,530 |
| 2022 | $11,565 | $405,780 | $58,250 | $347,530 |
| 2021 | $11,646 | $405,780 | $58,250 | $347,530 |
| 2020 | $11,362 | $405,780 | $58,250 | $347,530 |
| 2019 | $11,362 | $405,780 | $58,250 | $347,530 |
| 2018 | $10,927 | $390,240 | $70,470 | $319,770 |
| 2017 | $10,849 | $390,240 | $70,470 | $319,770 |
| 2016 | $10,849 | $390,240 | $70,470 | $319,770 |
Source: Public Records
Map
Nearby Homes
- 164 Birge Park Rd
- 21 South Rd
- 74 Pine Ridge Dr
- 28 Lily Pond Rd
- 25 Plymouth Rd
- 73 Shirley Rd
- 92 Shafer Rd
- 83 Shingle Mill Rd
- 51 Bradford Rd
- 175 Ramstein Rd
- 111 Oxbow Dr
- 195 County Line Rd
- 39 Orchard Hill Rd
- 69 Sunrise Dr
- 29 Branch Rd
- 144 Morningside Dr
- 33 Dawn Ave
- 410 Circle Dr
- 325 Circle Dr
- 29 Hannah Way
- 20 Stone Hedge Ct
- 31 Stone Hedge Ct
- 35 Stone Hedge Ct
- 23 Stone Hedge Ct
- 38 Stone Hedge Ct
- 21 Stone Hedge Ct
- 14 Stone Hedge Ct
- 45 Stone Hedge Ct
- 49 Stone Hedge Ct
- 6 Field Stone Way
- 51 N Gate Dr
- 5 Field Stone Way
- 4 Field Stone Way
- 3 Field Stone Way
- 1 N Gate Dr
- 17 N Gate Dr
- 158 North Rd
- 11 N Gate Dr
- 26 N Gate Dr
- 30 N Gate Dr