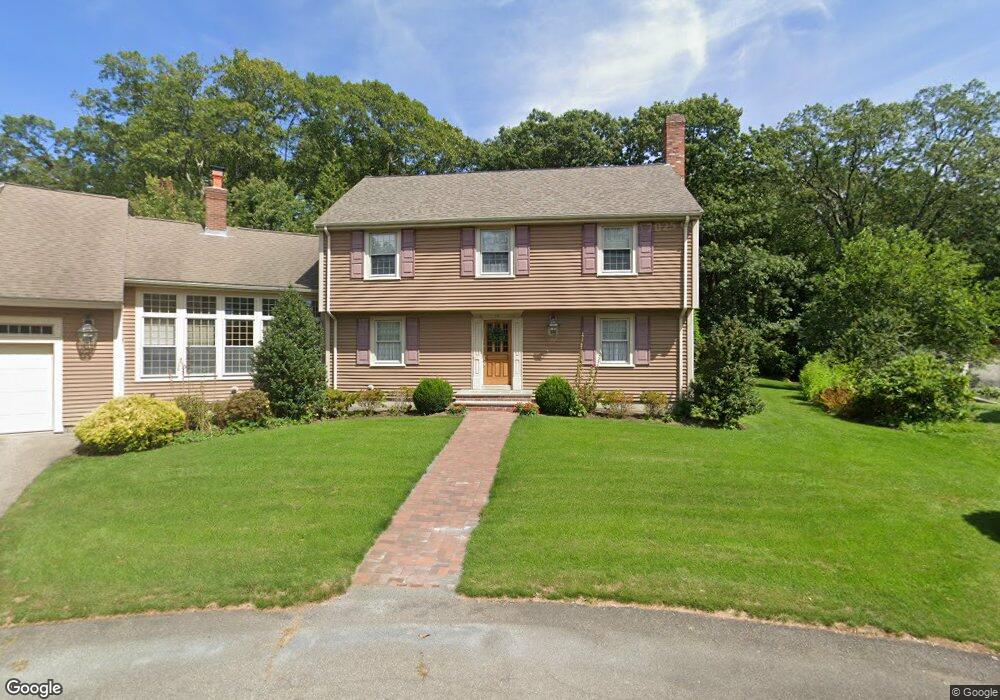
24 Sundin Cir Weymouth, MA 02188
Weymouth Landing NeighborhoodEstimated Value: $849,000 - $938,000
4
Beds
4
Baths
2,274
Sq Ft
$393/Sq Ft
Est. Value
About This Home
This home is located at 24 Sundin Cir, Weymouth, MA 02188 and is currently estimated at $894,082, approximately $393 per square foot. 24 Sundin Cir is a home located in Norfolk County with nearby schools including Abigail Adams Middle School, William Seach Elementary School, and Weymouth Middle School Chapman.
Ownership History
Date
Name
Owned For
Owner Type
Purchase Details
Closed on
Jan 24, 2024
Sold by
Dignan Sandra M
Bought by
Dignan Andrew J and Dignan Sandra M
Current Estimated Value
Create a Home Valuation Report for This Property
The Home Valuation Report is an in-depth analysis detailing your home's value as well as a comparison with similar homes in the area
Home Values in the Area
Average Home Value in this Area
Purchase History
| Date | Buyer | Sale Price | Title Company |
|---|---|---|---|
| Dignan Andrew J | -- | None Available | |
| Dignan Andrew J | -- | None Available |
Source: Public Records
Tax History Compared to Growth
Tax History
| Year | Tax Paid | Tax Assessment Tax Assessment Total Assessment is a certain percentage of the fair market value that is determined by local assessors to be the total taxable value of land and additions on the property. | Land | Improvement |
|---|---|---|---|---|
| 2025 | $9,010 | $892,100 | $258,100 | $634,000 |
| 2024 | $8,730 | $850,000 | $245,900 | $604,100 |
| 2023 | $8,283 | $792,600 | $227,700 | $564,900 |
| 2022 | $8,080 | $705,100 | $210,800 | $494,300 |
| 2021 | $7,620 | $649,100 | $210,800 | $438,300 |
| 2020 | $7,369 | $618,200 | $210,800 | $407,400 |
| 2019 | $7,247 | $597,900 | $202,700 | $395,200 |
| 2018 | $6,995 | $559,600 | $193,100 | $366,500 |
| 2017 | $6,789 | $530,000 | $184,000 | $346,000 |
| 2016 | $6,582 | $514,200 | $177,000 | $337,200 |
| 2015 | $6,144 | $476,300 | $169,100 | $307,200 |
| 2014 | $5,932 | $446,000 | $157,400 | $288,600 |
Source: Public Records
Map
Nearby Homes
- 42 Sundin Rd
- 286 Essex St
- 12 Klasson Ln
- 303 Middle St
- 449 Middle St
- 286 Broad St
- 367 Essex St
- 29-31 Broad Street Place
- 209 Lake St Unit 69
- 575 Broad St Unit 305
- 575 Broad St Unit 215
- 19 Vine St Unit 3
- 19 Vine St Unit 1
- 209 Lake Shore Dr
- 211 Lake Shore Dr
- 33 Congress St
- 114 Broad St Unit D
- 114 Broad St Unit C
- 23-25 Lindbergh Ave
- 16 Lindbergh Ave
- 17 Sundin Cir
- 45 House Rock Rd
- 37 House Rock Rd
- 53 House Rock Rd
- 8 Sundin Cir
- 34 Sundin Rd
- 29 House Rock Rd
- 61 House Rock Rd
- 46 House Rock Rd
- 22 Sundin Rd
- 38 House Rock Rd
- 54 House Rock Rd
- 48 Sundin Rd
- 21 House Rock Rd
- 35 Sundin Rd
- 30 House Rock Rd
- 25 Sundin Rd
- 62 House Rock Rd
- 29 Gale Rd
- 21 Gale Rd