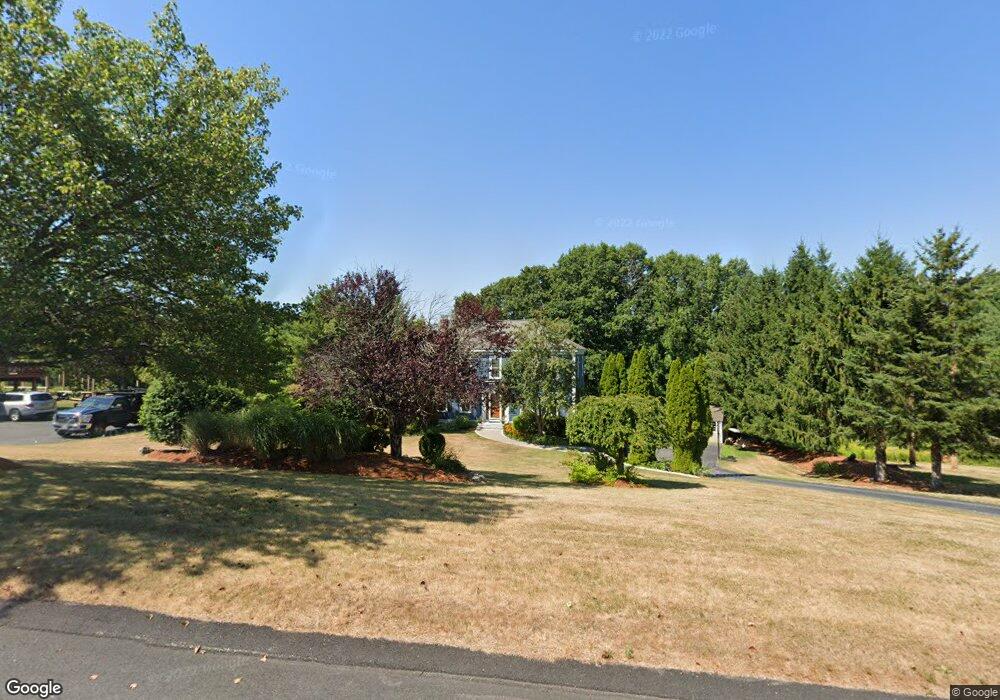
24 Thomas Newton Dr Westborough, MA 01581
Estimated Value: $926,735 - $1,289,000
4
Beds
3
Baths
2,398
Sq Ft
$456/Sq Ft
Est. Value
About This Home
This home is located at 24 Thomas Newton Dr, Westborough, MA 01581 and is currently estimated at $1,092,934, approximately $455 per square foot. 24 Thomas Newton Dr is a home located in Worcester County with nearby schools including Westborough High School, Westboro Knowledge Beginnings, and Ebridge Montessori School.
Ownership History
Date
Name
Owned For
Owner Type
Purchase Details
Closed on
Jun 23, 2006
Sold by
Oreilly-Rose Patricia J and Rose Paul J
Bought by
Kenny Holly A and Kenny Joseph J
Current Estimated Value
Home Financials for this Owner
Home Financials are based on the most recent Mortgage that was taken out on this home.
Original Mortgage
$481,600
Outstanding Balance
$281,942
Interest Rate
6.59%
Mortgage Type
Purchase Money Mortgage
Estimated Equity
$810,992
Purchase Details
Closed on
Oct 31, 1994
Sold by
Avey Randal T and Avey Linda
Bought by
Rose Paul J and Rose Patricia
Home Financials for this Owner
Home Financials are based on the most recent Mortgage that was taken out on this home.
Original Mortgage
$234,700
Interest Rate
8.65%
Mortgage Type
Purchase Money Mortgage
Purchase Details
Closed on
Sep 2, 1993
Sold by
Carrageen Dev Corp
Bought by
Avey Randal T and Avey Linda
Home Financials for this Owner
Home Financials are based on the most recent Mortgage that was taken out on this home.
Original Mortgage
$226,500
Interest Rate
7.11%
Mortgage Type
Purchase Money Mortgage
Create a Home Valuation Report for This Property
The Home Valuation Report is an in-depth analysis detailing your home's value as well as a comparison with similar homes in the area
Home Values in the Area
Average Home Value in this Area
Purchase History
| Date | Buyer | Sale Price | Title Company |
|---|---|---|---|
| Kenny Holly A | $602,000 | -- | |
| Rose Paul J | $262,500 | -- | |
| Avey Randal T | $251,700 | -- |
Source: Public Records
Mortgage History
| Date | Status | Borrower | Loan Amount |
|---|---|---|---|
| Open | Kenny Holly A | $481,600 | |
| Previous Owner | Avey Randal T | $196,500 | |
| Previous Owner | Avey Randal T | $220,000 | |
| Previous Owner | Avey Randal T | $234,700 | |
| Previous Owner | Avey Randal T | $226,500 |
Source: Public Records
Tax History Compared to Growth
Tax History
| Year | Tax Paid | Tax Assessment Tax Assessment Total Assessment is a certain percentage of the fair market value that is determined by local assessors to be the total taxable value of land and additions on the property. | Land | Improvement |
|---|---|---|---|---|
| 2025 | $13,667 | $839,000 | $351,900 | $487,100 |
| 2024 | $13,051 | $795,300 | $334,900 | $460,400 |
| 2023 | $12,142 | $721,000 | $315,900 | $405,100 |
| 2022 | $11,235 | $607,600 | $251,500 | $356,100 |
| 2021 | $11,081 | $597,700 | $241,600 | $356,100 |
| 2020 | $11,049 | $603,100 | $255,600 | $347,500 |
| 2019 | $11,053 | $603,000 | $251,600 | $351,400 |
| 2018 | $10,245 | $555,000 | $241,600 | $313,400 |
| 2017 | $9,879 | $555,000 | $241,600 | $313,400 |
| 2016 | $9,916 | $558,000 | $241,600 | $316,400 |
| 2015 | $9,425 | $507,000 | $213,400 | $293,600 |
Source: Public Records
Map
Nearby Homes
- 8 Samuel Harrington Rd
- 6 Walker St
- 28 Crestview Dr
- 3112 Peters Farm Way Unit 112
- 11302 Peters Farm Way Unit 11302
- 3102 Peters Farm Way Unit 102
- 12302 Peters Farm Way Unit 302
- 2 Talbot Way Unit 2103
- 2 Talbot Way Unit 2208
- 11101 Peters Farm Way Unit 101
- 5 Peters Farm Way Unit 106
- 5 Peters Farm Way Unit 406
- 5 Peters Farm Way Unit 113
- 5 Peters Farm Way Unit 105
- 5 Peters Farm Way Unit 213
- 5 Peters Farm Way Unit 212
- 8 Rock Spring Ln
- 2 Codman Way Unit 409
- 2 Codman Way Unit 113
- 2 Codman Way Unit 207
- 22 Thomas Newton Dr
- 26 Thomas Newton Dr
- 15 Wachusett View Dr
- 11 Wachusett View Dr
- 20 Thomas Newton Dr
- 23 Thomas Newton Dr
- 28 Thomas Newton Dr
- 25 Thomas Newton Dr
- 17 Wachusett View Dr
- 9 Wachusett View Dr
- 18 Thomas Newton Dr
- 27 Thomas Newton Dr
- 30 Thomas Newton Dr
- 16 Thomas Newton Dr
- 19 Thomas Newton Dr
- 19 Wachusett View Dr
- 1 Jacob Amsden Rd
- 3 Jacob Amsden Rd
- 29 Thomas Newton Dr
- 21 Thomas Newton Dr