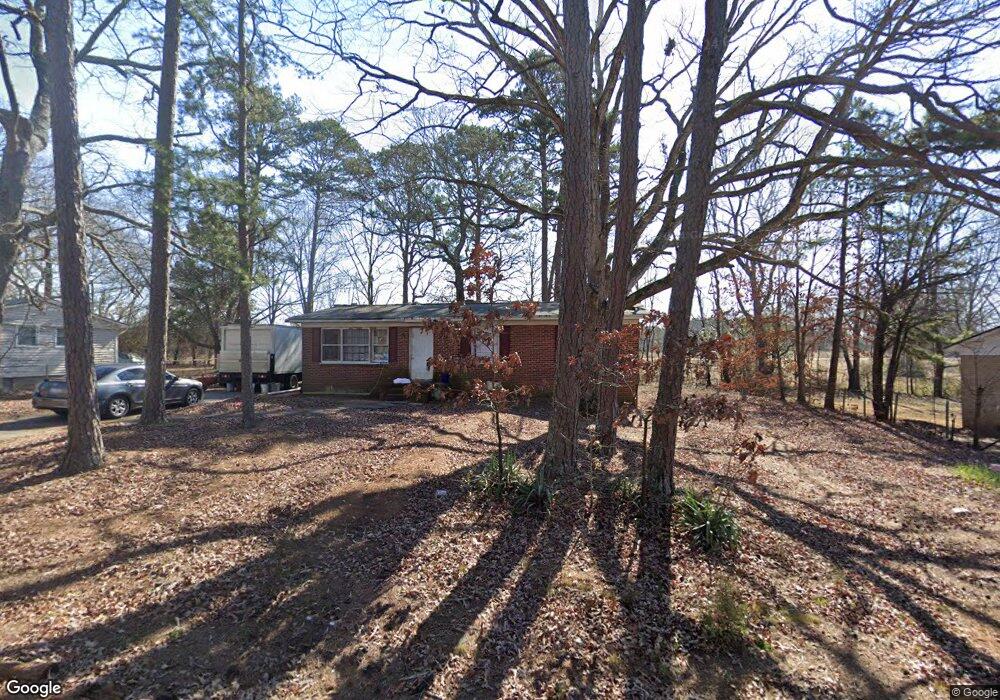
24 Thurgood Marshall Rd Spartanburg, SC 29307
Estimated Value: $91,000 - $163,000
3
Beds
1
Bath
1,075
Sq Ft
$108/Sq Ft
Est. Value
About This Home
This home is located at 24 Thurgood Marshall Rd, Spartanburg, SC 29307 and is currently estimated at $116,538, approximately $108 per square foot. 24 Thurgood Marshall Rd is a home located in Spartanburg County with nearby schools including Broome High School.
Ownership History
Date
Name
Owned For
Owner Type
Purchase Details
Closed on
Jan 10, 2018
Sold by
Brooks Investments Llc
Bought by
Reed Craig
Current Estimated Value
Home Financials for this Owner
Home Financials are based on the most recent Mortgage that was taken out on this home.
Original Mortgage
$19,000
Outstanding Balance
$16,017
Interest Rate
3.9%
Mortgage Type
Commercial
Estimated Equity
$100,521
Purchase Details
Closed on
Jun 1, 2006
Sold by
Godwin Brooks
Bought by
Brooks Investments Llc
Purchase Details
Closed on
May 25, 2005
Sold by
Renaissance Investments Llc
Bought by
Godwin Brooks
Home Financials for this Owner
Home Financials are based on the most recent Mortgage that was taken out on this home.
Original Mortgage
$46,000
Interest Rate
5.69%
Mortgage Type
Future Advance Clause Open End Mortgage
Purchase Details
Closed on
Jan 4, 2004
Sold by
Hull Marshall and Hull Ellen Ruth
Bought by
Nationscredit Financial Services Corp and Equicredit Corp Of America
Create a Home Valuation Report for This Property
The Home Valuation Report is an in-depth analysis detailing your home's value as well as a comparison with similar homes in the area
Home Values in the Area
Average Home Value in this Area
Purchase History
| Date | Buyer | Sale Price | Title Company |
|---|---|---|---|
| Reed Craig | $20,000 | None Available | |
| Brooks Investments Llc | -- | None Available | |
| Godwin Brooks | $30,000 | -- | |
| Renaissance Investments Llc | $24,750 | -- | |
| Front Street Investments Inc | $19,000 | -- | |
| Nationscredit Financial Services Corp | $500 | -- |
Source: Public Records
Mortgage History
| Date | Status | Borrower | Loan Amount |
|---|---|---|---|
| Open | Reed Craig | $19,000 | |
| Previous Owner | Renaissance Investments Llc | $46,000 |
Source: Public Records
Tax History Compared to Growth
Tax History
| Year | Tax Paid | Tax Assessment Tax Assessment Total Assessment is a certain percentage of the fair market value that is determined by local assessors to be the total taxable value of land and additions on the property. | Land | Improvement |
|---|---|---|---|---|
| 2025 | $147 | $410 | $199 | $211 |
| 2024 | $147 | $410 | $199 | $211 |
| 2023 | $147 | $410 | $65 | $345 |
| 2022 | $130 | $356 | $132 | $224 |
| 2021 | $130 | $356 | $132 | $224 |
| 2020 | $122 | $356 | $132 | $224 |
| 2019 | $132 | $356 | $132 | $224 |
| 2018 | $891 | $1,917 | $281 | $1,636 |
| 2017 | $785 | $1,666 | $272 | $1,394 |
| 2016 | $784 | $1,666 | $272 | $1,394 |
| 2015 | $776 | $1,666 | $272 | $1,394 |
| 2014 | $769 | $1,666 | $272 | $1,394 |
Source: Public Records
Map
Nearby Homes
- 49 Thurgood Marshall Rd
- 000 Burns Rd Unit LOT 1
- 000 Burns Rd
- 000 Burns Rd Unit LOT 2
- Lot 31 State Road S-42-2288
- Lot 20 Peach Valley Cir
- 2959 Chesnee Hwy
- 451 Old Chesnee Hwy
- 455 Old Chesnee Hwy
- 459 Old Chesnee Hwy
- 134 Harvest Moon Ln
- 415 Ware Rd
- 302 Peach Valley Dr
- 124 Childress Rd
- 204 Bennett Dairy Rd
- 150 Ware Rd
- 215 Penny Bennett Rd
- 299 Sequoyah Dr
- 325 R C Thompson Rd
- 1926 Bud Arthur Bridge Rd
- 26 Thurgood Marshall Rd
- 22 Thurgood Marshall Rd
- 28 Thurgood Marshall Rd
- 2 Benjamin Mays Dr
- 20 Thurgood Marshall Rd
- 27 Thurgood Marshall Rd
- 39 Thurgood Marshall Rd
- 18 Thurgood Marshall Rd
- 4 Benjamin Mays Dr
- 3 Benjamin Mays Dr
- 41 Thurgood Marshall Rd
- 34 Thurgood Marshall Rd
- 16 Thurgood Marshall Rd
- 5 Benjamin Mays Dr
- 32 Thurgood Marshall Rd
- 623 Mount Pleasant Rd
- 6 Benjamin Mays Dr
- 38 Thurgood Marshall Rd
- 43 Thurgood Marshall Rd
- 7 Benjamin Mays Dr