Estimated Value: $131,000 - $153,674
2
Beds
1
Bath
924
Sq Ft
$155/Sq Ft
Est. Value
About This Home
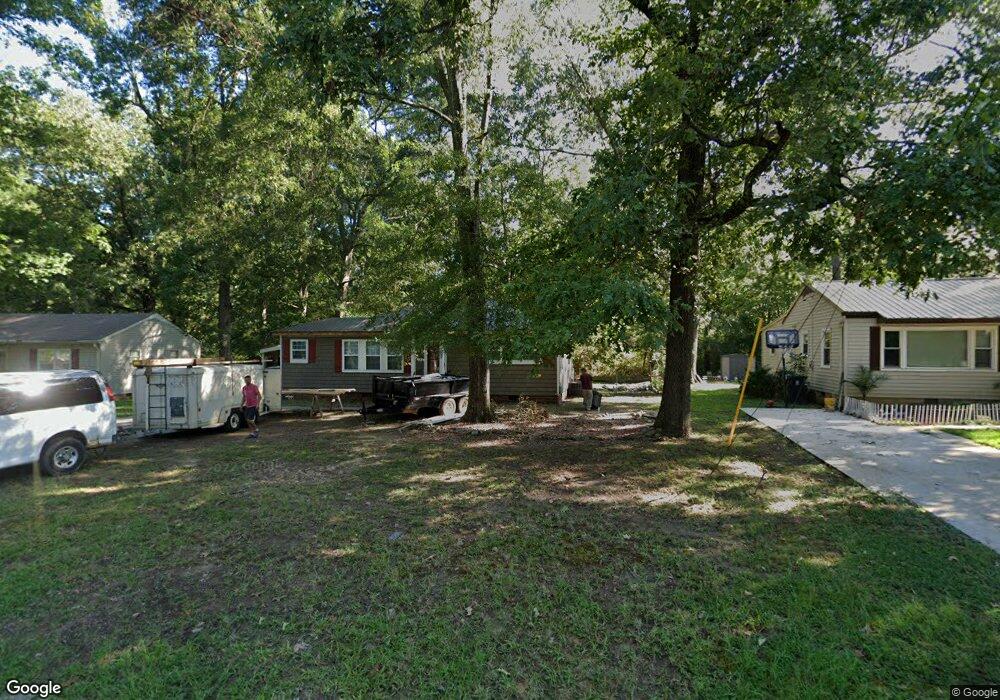
This home is located at 24 Tyler St NW, Rome, GA 30165 and is currently estimated at $142,919, approximately $154 per square foot. 24 Tyler St NW is a home located in Floyd County with nearby schools including Rome High School.
Ownership History
Date
Name
Owned For
Owner Type
Purchase Details
Closed on
Jun 13, 2020
Sold by
Wendell Fincher Construction Inc
Bought by
Fincher Sharonw Lumsden
Current Estimated Value
Home Financials for this Owner
Home Financials are based on the most recent Mortgage that was taken out on this home.
Original Mortgage
$90,000
Outstanding Balance
$71,628
Interest Rate
3.2%
Mortgage Type
New Conventional
Estimated Equity
$71,291
Purchase Details
Closed on
May 14, 2008
Sold by
Not Provided
Bought by
Wendell Fincher Construction Inc
Purchase Details
Closed on
Jan 18, 2008
Sold by
Not Provided
Bought by
Wendell Fincher Construction Inc
Purchase Details
Closed on
Nov 6, 2007
Sold by
Blanton Jeramiah
Bought by
Chase Home Finance Llc
Purchase Details
Closed on
Jun 1, 2006
Sold by
Not Provided
Bought by
Wendell Fincher Construction Inc
Purchase Details
Closed on
Aug 21, 2003
Sold by
Parker Susan J
Bought by
Blanton Jeramiah
Purchase Details
Closed on
Aug 20, 2001
Sold by
Lowery Lynda T and Lowery James G
Bought by
Parker Susan J
Purchase Details
Closed on
Apr 3, 1985
Bought by
Lowery Lynda T and Lowery James G
Create a Home Valuation Report for This Property
The Home Valuation Report is an in-depth analysis detailing your home's value as well as a comparison with similar homes in the area
Home Values in the Area
Average Home Value in this Area
Purchase History
| Date | Buyer | Sale Price | Title Company |
|---|---|---|---|
| Fincher Sharonw Lumsden | $90,000 | -- | |
| Wendell Fincher Construction Inc | -- | -- | |
| Wendell Fincher Construction I | $42,000 | -- | |
| Wendell Fincher Construction Inc | -- | -- | |
| Wendell Fincher Construction Inc | $71,333 | -- | |
| Chase Home Finance Llc | $71,300 | -- | |
| Wendell Fincher Construction Inc | -- | -- | |
| Blanton Jeramiah | $66,800 | -- | |
| Parker Susan J | $59,900 | -- | |
| Lowery Lynda T | $26,900 | -- |
Source: Public Records
Mortgage History
| Date | Status | Borrower | Loan Amount |
|---|---|---|---|
| Open | Fincher Sharonw Lumsden | $90,000 |
Source: Public Records
Tax History Compared to Growth
Tax History
| Year | Tax Paid | Tax Assessment Tax Assessment Total Assessment is a certain percentage of the fair market value that is determined by local assessors to be the total taxable value of land and additions on the property. | Land | Improvement |
|---|---|---|---|---|
| 2024 | $1,799 | $44,487 | $6,577 | $37,910 |
| 2023 | $1,575 | $39,254 | $5,979 | $33,275 |
| 2022 | $1,193 | $32,692 | $4,783 | $27,909 |
| 2021 | $1,114 | $30,023 | $4,783 | $25,240 |
| 2020 | $1,037 | $27,722 | $3,588 | $24,134 |
| 2019 | $952 | $25,719 | $3,588 | $22,131 |
| 2018 | $910 | $24,592 | $3,588 | $21,004 |
| 2017 | $887 | $23,965 | $3,588 | $20,377 |
| 2016 | $863 | $23,242 | $3,560 | $19,682 |
| 2015 | $815 | $23,242 | $3,560 | $19,682 |
| 2014 | $815 | $23,242 | $3,560 | $19,682 |
Source: Public Records
Map
Nearby Homes
- 2614 Garden Lakes Blvd NW
- 104 Morgan Dr NW
- 2602 Lakeridge Cir NW
- 320 Elliott Dr NW
- 1 Lindsey Terrace NW
- 13 Crosscreek Dr NW
- 8 Sagewood Dr NW
- 38 Boulder Dr NW
- 24 Conway Place NW
- 233 Longmeadow Dr NW
- 1 Addington Ct NW Unit B
- 104 Sagewood Dr NW
- 46 Cornerstone Dr NW
- 23 Westwillow Ln NW
- 25 Shoreline Dr NW
- 9 Prescott Ln NW
- 11 Simpson Dr NW
- 118 Melody Ln NW
- 11 Pinestream Dr NW
- 32 Donley Dr NW
- 26 Tyler St NW
- 22 Tyler St NW
- 26 Tylerm St
- 28 Tyler St NW
- 13 Elliott Cir NW
- 15 Elliott Cir NW
- 19 Tyler St NW
- 11 Elliott Cir NW
- 21 Tyler St NW
- 17 Tyler St NW
- 18 Tyler St NW
- 104 Plymouth Rd NW
- 30 Tyler St NW
- 15 Tyler St NW
- 22 Plymouth Rd NW
- 16 Tyler St NW
- 17 Elliott Cir NW
- 0 Elliott Cir NW Unit 7378846
- 0 Elliott Cir NW Unit 7287407
- 0 Elliott Cir NW Unit 7245154