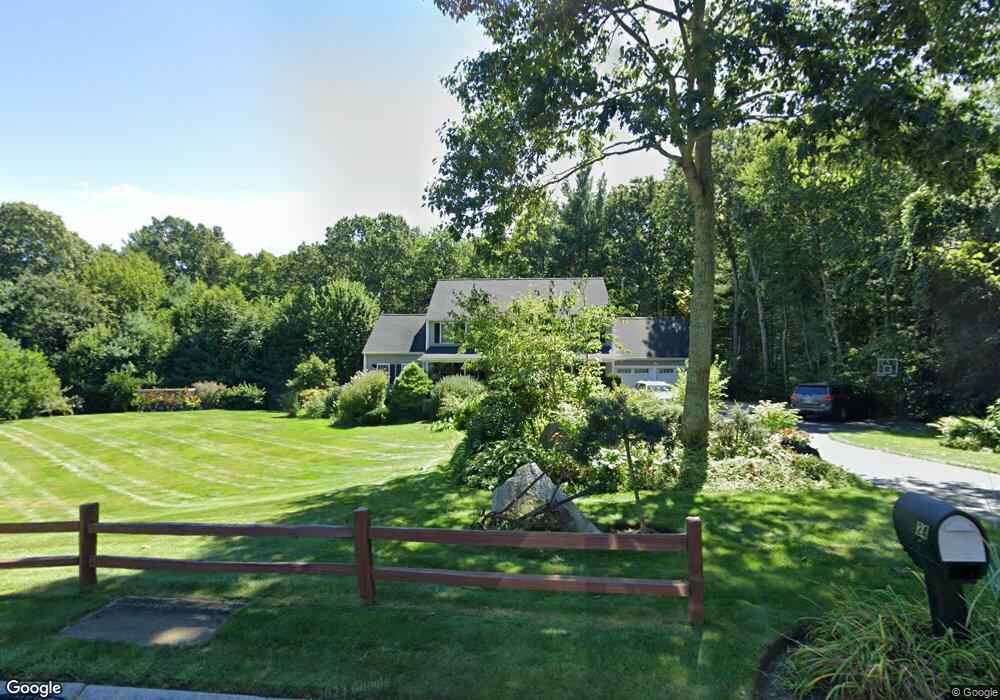
24 Vincent Rd Mendon, MA 01756
Estimated Value: $890,185 - $1,203,000
4
Beds
3
Baths
3,748
Sq Ft
$275/Sq Ft
Est. Value
About This Home
This home is located at 24 Vincent Rd, Mendon, MA 01756 and is currently estimated at $1,032,546, approximately $275 per square foot. 24 Vincent Rd is a home located in Worcester County with nearby schools including Nipmuc Regional High School, Bethany Christian Academy, and Mendon Mennonite School.
Ownership History
Date
Name
Owned For
Owner Type
Purchase Details
Closed on
Aug 12, 2011
Sold by
Biagiott Kristine E
Bought by
Biagiott Kristine E and Bridges Brian D
Current Estimated Value
Home Financials for this Owner
Home Financials are based on the most recent Mortgage that was taken out on this home.
Original Mortgage
$120,000
Outstanding Balance
$7,226
Interest Rate
4.51%
Mortgage Type
Purchase Money Mortgage
Estimated Equity
$1,025,320
Purchase Details
Closed on
Feb 25, 2011
Sold by
Baker Harry C and Hines-Baker Reginam
Bought by
Biagiotti Kristine E
Home Financials for this Owner
Home Financials are based on the most recent Mortgage that was taken out on this home.
Original Mortgage
$336,000
Interest Rate
4.75%
Mortgage Type
Purchase Money Mortgage
Purchase Details
Closed on
Feb 24, 1999
Sold by
Blueberry Dev T and Gollinger John F
Bought by
Baker Harry C and Baker Regina M
Create a Home Valuation Report for This Property
The Home Valuation Report is an in-depth analysis detailing your home's value as well as a comparison with similar homes in the area
Home Values in the Area
Average Home Value in this Area
Purchase History
| Date | Buyer | Sale Price | Title Company |
|---|---|---|---|
| Biagiott Kristine E | -- | -- | |
| Biagiotti Kristine E | $420,000 | -- | |
| Baker Harry C | $85,000 | -- |
Source: Public Records
Mortgage History
| Date | Status | Borrower | Loan Amount |
|---|---|---|---|
| Open | Biagiott Kristine E | $120,000 | |
| Previous Owner | Biagiotti Kristine E | $336,000 | |
| Previous Owner | Baker Harry C | $60,000 | |
| Previous Owner | Baker Harry C | $222,000 |
Source: Public Records
Tax History
| Year | Tax Paid | Tax Assessment Tax Assessment Total Assessment is a certain percentage of the fair market value that is determined by local assessors to be the total taxable value of land and additions on the property. | Land | Improvement |
|---|---|---|---|---|
| 2025 | $11,240 | $839,400 | $196,400 | $643,000 |
| 2024 | $11,016 | $803,500 | $188,900 | $614,600 |
| 2023 | $10,655 | $729,800 | $168,500 | $561,300 |
| 2022 | $10,436 | $677,200 | $168,400 | $508,800 |
| 2021 | $10,025 | $597,100 | $163,300 | $433,800 |
| 2020 | $9,512 | $567,900 | $156,600 | $411,300 |
| 2019 | $9,162 | $547,300 | $145,600 | $401,700 |
| 2018 | $9,158 | $540,000 | $145,600 | $394,400 |
| 2017 | $9,088 | $512,000 | $145,600 | $366,400 |
| 2016 | $8,775 | $508,700 | $147,500 | $361,200 |
| 2015 | $8,021 | $501,000 | $147,500 | $353,500 |
| 2014 | $7,800 | $486,900 | $149,600 | $337,300 |
Source: Public Records
Map
Nearby Homes
- 93 Providence St Unit B
- 111 Providence St
- 183 Blackstone St
- 8 Puffer Dr
- 50 Hartford Ave E
- 10 Wesley Dr
- 14 Kelley Rd
- 13 Kelley Rd
- 3 Daniels Rd
- 26 Maple St
- 23 Bens Way
- 25 Bens Way
- 24 Talbott Farm Dr
- 19 Bens Way
- 8 Washington St
- 27 Taft Ave
- 23 Uxbridge Rd
- 220 Millville Rd
- 106 Laurelwood Dr Unit 106
- 89 Laurelwood Dr Unit 89
Your Personal Tour Guide
Ask me questions while you tour the home.