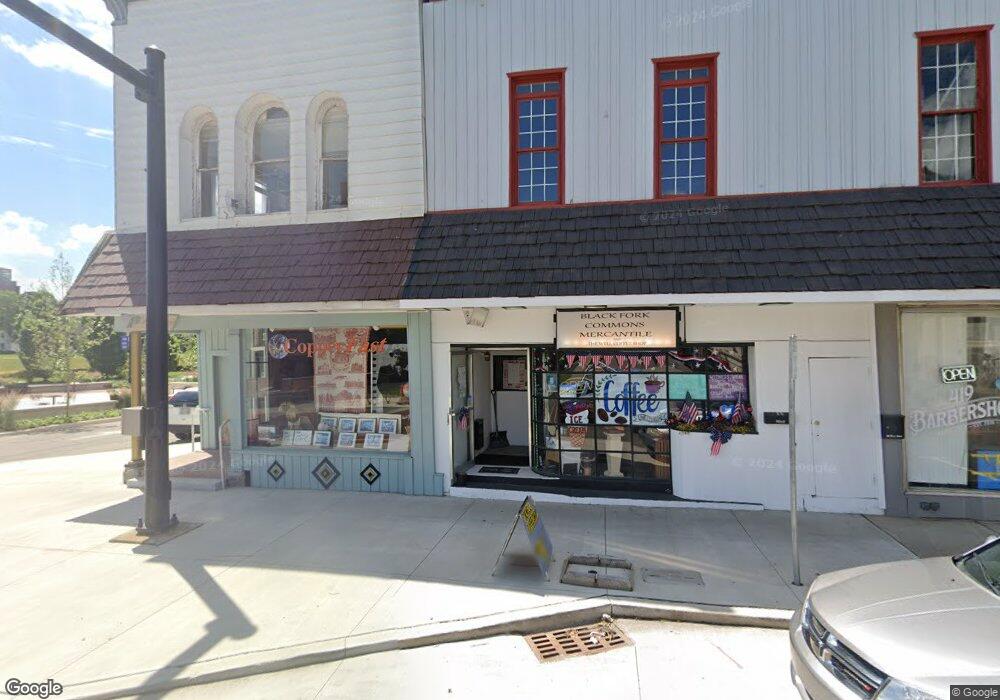
24 W Main St Shelby, OH 44875
Estimated Value: $101,704
--
Bed
--
Bath
4,314
Sq Ft
$24/Sq Ft
Est. Value
About This Home
This home is located at 24 W Main St, Shelby, OH 44875 and is currently estimated at $101,704, approximately $23 per square foot. 24 W Main St is a home located in Richland County with nearby schools including St. Mary's School.
Ownership History
Date
Name
Owned For
Owner Type
Purchase Details
Closed on
May 23, 2025
Sold by
Hall Anthony R and Hall Beverly A
Bought by
Ignited
Current Estimated Value
Purchase Details
Closed on
Oct 18, 2019
Sold by
Roub Constance M
Bought by
Hall Anthony R and Hall Beverly A
Purchase Details
Closed on
Sep 4, 2012
Sold by
Potts Sheryl L and Delong Sheryl L
Bought by
Roub Constance M
Purchase Details
Closed on
Nov 21, 2008
Sold by
Re Pete Ventures Ltd
Bought by
Delong Sheryl L
Purchase Details
Closed on
Feb 12, 1998
Sold by
Parsons Thomas F
Bought by
Re Pete Ventures Ltd
Purchase Details
Closed on
Feb 1, 1986
Create a Home Valuation Report for This Property
The Home Valuation Report is an in-depth analysis detailing your home's value as well as a comparison with similar homes in the area
Home Values in the Area
Average Home Value in this Area
Purchase History
| Date | Buyer | Sale Price | Title Company |
|---|---|---|---|
| Ignited | $100,000 | None Listed On Document | |
| Ignited | $100,000 | None Listed On Document | |
| Hall Anthony R | $23,000 | Southern Title | |
| Roub Constance M | $18,000 | Attorney | |
| Delong Sheryl L | $7,500 | Attorney | |
| Re Pete Ventures Ltd | $36,500 | -- | |
| -- | $45,000 | -- |
Source: Public Records
Tax History Compared to Growth
Tax History
| Year | Tax Paid | Tax Assessment Tax Assessment Total Assessment is a certain percentage of the fair market value that is determined by local assessors to be the total taxable value of land and additions on the property. | Land | Improvement |
|---|---|---|---|---|
| 2024 | $1,118 | $19,500 | $840 | $18,660 |
| 2023 | $1,118 | $19,500 | $840 | $18,660 |
| 2022 | $329 | $5,160 | $760 | $4,400 |
| 2021 | $330 | $5,160 | $760 | $4,400 |
| 2020 | $328 | $5,160 | $760 | $4,400 |
| 2019 | $276 | $4,220 | $760 | $3,460 |
| 2018 | $286 | $4,220 | $760 | $3,460 |
| 2017 | $283 | $4,220 | $760 | $3,460 |
| 2016 | $138 | $2,020 | $440 | $1,580 |
| 2015 | $138 | $2,020 | $440 | $1,580 |
| 2014 | $134 | $2,020 | $440 | $1,580 |
| 2012 | $130 | $2,020 | $440 | $1,580 |
Source: Public Records
Map
Nearby Homes