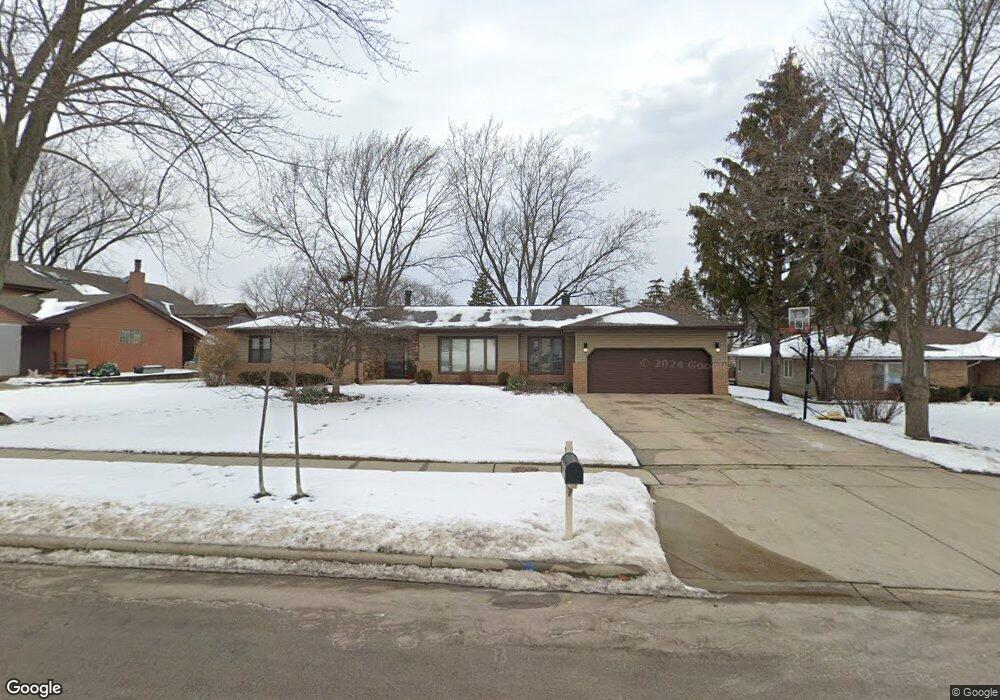
24 W Niagara Ave Schaumburg, IL 60193
South Schaumburg NeighborhoodEstimated Value: $513,300 - $643,000
4
Beds
3
Baths
2,024
Sq Ft
$283/Sq Ft
Est. Value
About This Home
This home is located at 24 W Niagara Ave, Schaumburg, IL 60193 and is currently estimated at $572,575, approximately $282 per square foot. 24 W Niagara Ave is a home located in Cook County with nearby schools including Edwin Aldrin Elementary School, Robert Frost Junior High School, and J B Conant High School.
Ownership History
Date
Name
Owned For
Owner Type
Purchase Details
Closed on
Jul 13, 2007
Sold by
Huntzicker Dan L
Bought by
Symonds Stephen and Symonds Hanna
Current Estimated Value
Home Financials for this Owner
Home Financials are based on the most recent Mortgage that was taken out on this home.
Original Mortgage
$345,000
Outstanding Balance
$218,213
Interest Rate
6.73%
Mortgage Type
Unknown
Estimated Equity
$354,362
Purchase Details
Closed on
May 28, 1996
Sold by
Strobel Charles W and Strobel Hester E
Bought by
Huntzicker Dan L
Home Financials for this Owner
Home Financials are based on the most recent Mortgage that was taken out on this home.
Original Mortgage
$168,000
Interest Rate
7.97%
Purchase Details
Closed on
May 22, 1995
Sold by
Strobel Charles W and Strobel Hester E
Bought by
Strobel Charles W and Strobel Hester E
Create a Home Valuation Report for This Property
The Home Valuation Report is an in-depth analysis detailing your home's value as well as a comparison with similar homes in the area
Home Values in the Area
Average Home Value in this Area
Purchase History
| Date | Buyer | Sale Price | Title Company |
|---|---|---|---|
| Symonds Stephen | $500,000 | Multiple | |
| Huntzicker Dan L | $210,000 | -- | |
| Strobel Charles W | -- | -- |
Source: Public Records
Mortgage History
| Date | Status | Borrower | Loan Amount |
|---|---|---|---|
| Open | Symonds Stephen | $345,000 | |
| Previous Owner | Huntzicker Dan L | $168,000 |
Source: Public Records
Tax History Compared to Growth
Tax History
| Year | Tax Paid | Tax Assessment Tax Assessment Total Assessment is a certain percentage of the fair market value that is determined by local assessors to be the total taxable value of land and additions on the property. | Land | Improvement |
|---|---|---|---|---|
| 2024 | $9,716 | $38,000 | $8,000 | $30,000 |
| 2023 | $9,393 | $38,000 | $8,000 | $30,000 |
| 2022 | $9,393 | $38,000 | $8,000 | $30,000 |
| 2021 | $7,610 | $28,438 | $22,500 | $5,938 |
| 2020 | $7,547 | $28,438 | $22,500 | $5,938 |
| 2019 | $7,550 | $31,598 | $22,500 | $9,098 |
| 2018 | $9,514 | $35,137 | $19,000 | $16,137 |
| 2017 | $9,382 | $35,137 | $19,000 | $16,137 |
| 2016 | $9,016 | $35,137 | $19,000 | $16,137 |
| 2015 | $7,647 | $28,183 | $16,000 | $12,183 |
| 2014 | $7,579 | $28,183 | $16,000 | $12,183 |
| 2013 | $7,367 | $28,183 | $16,000 | $12,183 |
Source: Public Records
Map
Nearby Homes
- 13 W Monterey Ave
- 1323 S Roselle Rd
- 134 Lunt Ave
- 211 Steeple Bush Ln Unit 10343
- 205 Steeple Bush Ln Unit 10444
- 1420 Indian Hill Dr
- 1342 Lunt Ct Unit 56
- 1205 Laurel Ln
- 1531 Marion St
- 357 Lucille Ln Unit 30
- 120 Pratt Blvd
- 1630 Myrtle Park St
- 1630 Myrtle Park St
- 1630 Myrtle Park St
- 286 Nantucket Harbor Unit 601
- 415 Laconia Ln
- 1705 Seward St
- 1078 Newport Harbor Unit 6101
- 220 Mountain Interval Rd Unit 6224
- 228 Warren Ln Unit 11645
- 20 W Niagara Ave
- 30 W Niagara Ave
- 30 W Niagara Ave
- 21 W Wise Rd
- 25 W Wise Rd
- 36 W Niagara Ave
- 14 W Niagara Ave
- 13 W Wise Rd Unit 13
- 13 W Wise Rd
- 25 W Niagara Ave
- 21 W Niagara Ave
- 7 W Wise Rd
- 31 W Niagara Ave
- 8 W Niagara Ave
- 15 W Niagara Ave
- 37 W Niagara Ave
- 112 W Niagara Ave
- 5 W Niagara Ave
- 109 W Niagara Ave
- 18 W Monterey Ave