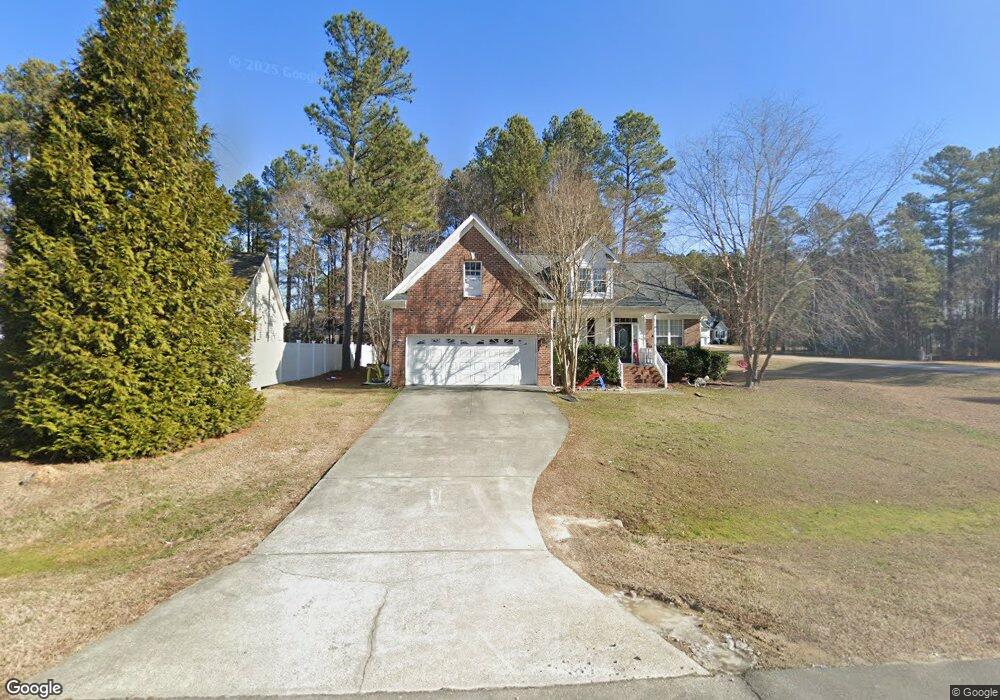
24 Waterfall Rd Henderson, NC 27537
Estimated Value: $270,138 - $326,000
3
Beds
2
Baths
1,906
Sq Ft
$158/Sq Ft
Est. Value
About This Home
This home is located at 24 Waterfall Rd, Henderson, NC 27537 and is currently estimated at $300,285, approximately $157 per square foot. 24 Waterfall Rd is a home located in Vance County with nearby schools including Dabney Elementary School, Vance County High School, and Kerr-Vance Academy.
Ownership History
Date
Name
Owned For
Owner Type
Purchase Details
Closed on
Mar 4, 2019
Sold by
Fleming Frampton Jamie and Frampton Richard Bruce
Bought by
Orr Rhodes Cassie
Current Estimated Value
Home Financials for this Owner
Home Financials are based on the most recent Mortgage that was taken out on this home.
Original Mortgage
$201,000
Outstanding Balance
$178,355
Interest Rate
4.87%
Mortgage Type
Adjustable Rate Mortgage/ARM
Estimated Equity
$121,930
Purchase Details
Closed on
Aug 17, 2006
Sold by
Den Mark Construction Inc
Bought by
Frampton Jamie Fleming and Frampton Richard Bruce
Home Financials for this Owner
Home Financials are based on the most recent Mortgage that was taken out on this home.
Original Mortgage
$177,750
Interest Rate
5.75%
Mortgage Type
New Conventional
Create a Home Valuation Report for This Property
The Home Valuation Report is an in-depth analysis detailing your home's value as well as a comparison with similar homes in the area
Purchase History
| Date | Buyer | Sale Price | Title Company |
|---|---|---|---|
| Orr Rhodes Cassie | $199,000 | None Available | |
| Frampton Jamie Fleming | $197,500 | -- |
Source: Public Records
Mortgage History
| Date | Status | Borrower | Loan Amount |
|---|---|---|---|
| Open | Orr Rhodes Cassie | $201,000 | |
| Previous Owner | Frampton Jamie Fleming | $177,750 |
Source: Public Records
Tax History
| Year | Tax Paid | Tax Assessment Tax Assessment Total Assessment is a certain percentage of the fair market value that is determined by local assessors to be the total taxable value of land and additions on the property. | Land | Improvement |
|---|---|---|---|---|
| 2025 | $1,744 | $199,043 | $19,120 | $179,923 |
| 2024 | $1,684 | $199,123 | $19,200 | $179,923 |
| 2023 | $1,810 | $172,658 | $18,000 | $154,658 |
| 2022 | $1,810 | $172,658 | $18,000 | $154,658 |
| 2021 | $1,690 | $172,658 | $18,000 | $154,658 |
| 2020 | $1,807 | $172,658 | $18,000 | $154,658 |
| 2019 | $1,802 | $172,658 | $18,000 | $154,658 |
| 2018 | $1,613 | $172,658 | $18,000 | $154,658 |
| 2017 | $1,718 | $172,658 | $18,000 | $154,658 |
| 2016 | $1,672 | $167,720 | $18,000 | $149,720 |
| 2015 | $1,588 | $193,550 | $27,000 | $166,550 |
| 2014 | $1,716 | $193,613 | $27,000 | $166,613 |
Source: Public Records
Map
Nearby Homes
- 399 W Waycliff Rd
- 160 Shadowbrook Dr
- 0 Us Hwy 158 Hwy Unit CAR4105253
- 42 Tall Pines Dr
- 000 Horseshoe Bend Rd
- 4688 Dorsey Rd
- 4710 Dorsey Rd
- 84 Weybossett Rd
- 5204 Tabbs Creek Ln
- 5306 Langdon Dr
- 5310 Langdon Dr
- 91 Pine Ridge Trail
- 75 Spring Hill Ln
- 4098 Charlie Harris Rd
- 119 Deer Wood Trail
- 1822 Ruin Creek Rd
- 1630 Ruin Creek Rd
- 5503 Antioch Rd
- 4076 Salem Farms Rd
- 2535 Fairway Dr Unit 3
- 48 Waterfall Rd
- 39 N Cinnebar Ct
- 70 Waterfall Rd
- 146 E Waycliff Rd
- 38 S Cinnebar Ct
- 27 Waterfall Rd
- 81 N Cinnebar Ct
- 59 Waterfall Rd
- 96 Waterfall Rd
- 34 N Cinnebar Ct
- 94 S Cinnebar Ct
- 85 Waterfall Rd
- 124 S Cinnebar Ct
- 29 S Cinnebar Ct
- 124 Waterfall Rd
- 80 N Cinnebar Ct
- 113 Waterfall Rd
- 113 Waterfall Rd
- 47 E Waycliff Rd
- 292 E Waycliff Rd
Your Personal Tour Guide
Ask me questions while you tour the home.