24 Wave Ave Wakefield, MA 01880
Lakeside NeighborhoodEstimated Value: $1,005,000 - $1,120,085
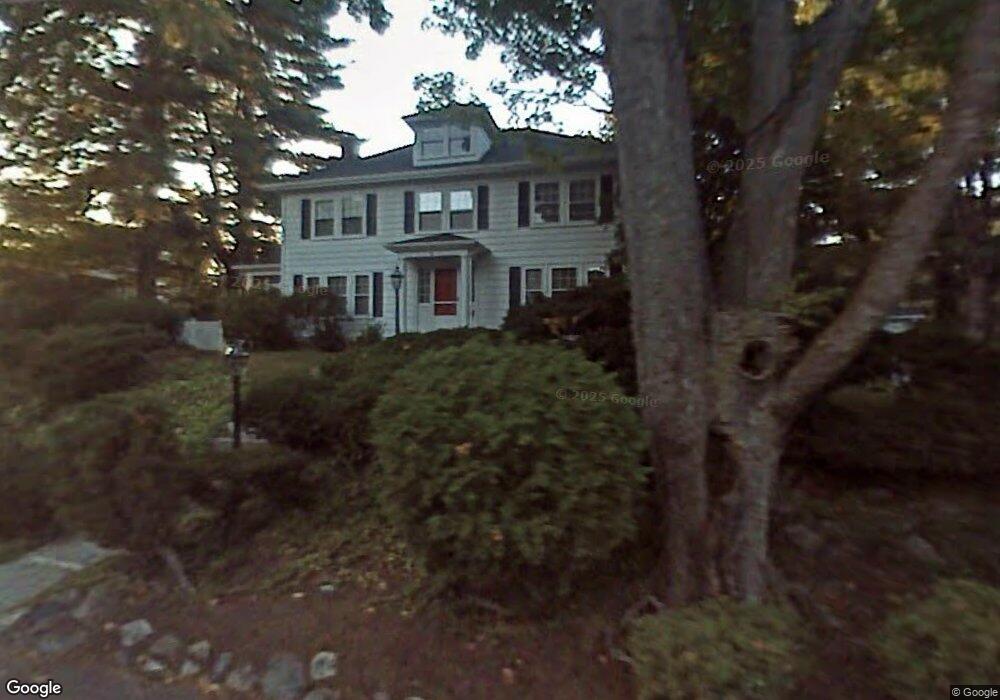
About This Home
This home is located at 24 Wave Ave, Wakefield, MA 01880 and is currently estimated at $1,066,271, approximately $459 per square foot. 24 Wave Ave is a home located in Middlesex County with nearby schools including Wakefield Memorial High School, St Joseph School, and Odyssey Day School.
Ownership History
We collect this data history from publicly available records. To have your information removed, we recommend requesting removal directly through your county’s website.
Purchase Details
Purchase Details
Purchase Details
Home Values in the Area
Average Home Value in this Area
Purchase History
We collect this data history from publicly available records. To have your information removed, we recommend requesting removal directly through your county’s website.
| Date | Buyer | Sale Price | Title Company |
|---|---|---|---|
| -- | None Available | ||
| $600,000 | -- | ||
| $263,500 | -- |
Mortgage History
We collect this data history from publicly available records. To have your information removed, we recommend requesting removal directly through your county’s website.
| Date | Status | Borrower | Loan Amount |
|---|---|---|---|
| Previous Owner | $380,000 | ||
| Previous Owner | $397,000 |
Tax History
We collect this data history from publicly available records. To have your information removed, we recommend requesting removal directly through your county’s website.
| Year | Tax Paid | Tax Assessment Tax Assessment Total Assessment is a certain percentage of the fair market value that is determined by local assessors to be the total taxable value of land and additions on the property. | Land | Improvement |
|---|---|---|---|---|
| 2025 | $11,373 | $1,002,000 | $417,200 | $584,800 |
| 2024 | $10,603 | $942,500 | $392,300 | $550,200 |
| 2023 | $10,434 | $889,500 | $370,100 | $519,400 |
| 2022 | $9,967 | $809,000 | $336,400 | $472,600 |
| 2021 | $9,565 | $751,400 | $316,200 | $435,200 |
| 2020 | $9,036 | $707,600 | $297,800 | $409,800 |
| 2019 | $8,636 | $673,100 | $283,300 | $389,800 |
| 2018 | $8,313 | $641,900 | $270,100 | $371,800 |
| 2017 | $8,161 | $626,300 | $263,500 | $362,800 |
| 2016 | $7,763 | $575,500 | $261,500 | $314,000 |
| 2015 | $7,467 | $553,900 | $251,600 | $302,300 |
| 2014 | $6,942 | $543,200 | $246,700 | $296,500 |
Map
- 20 Lawrence St Unit 2
- 9 White Ave
- 22 Sweetser St
- 284 Main St
- 24 Park St
- 22 Park St Unit B
- 22 Park St Unit A
- 6 Highland St
- 44 Church St
- 7 Beebe Ln
- 50 Albion St
- 48 N Emerson St Unit 1
- 202 Salem St
- 4 Wakefield Ave Unit 4
- 68 Preston St Unit 9D
- 68 Preston St Unit 3D
- 19 Butler Ave
- 234 Water St Unit 205
- 11 Columbia Rd Unit 8
- 19 Wakefield Ave
Ask me questions while you tour the home.