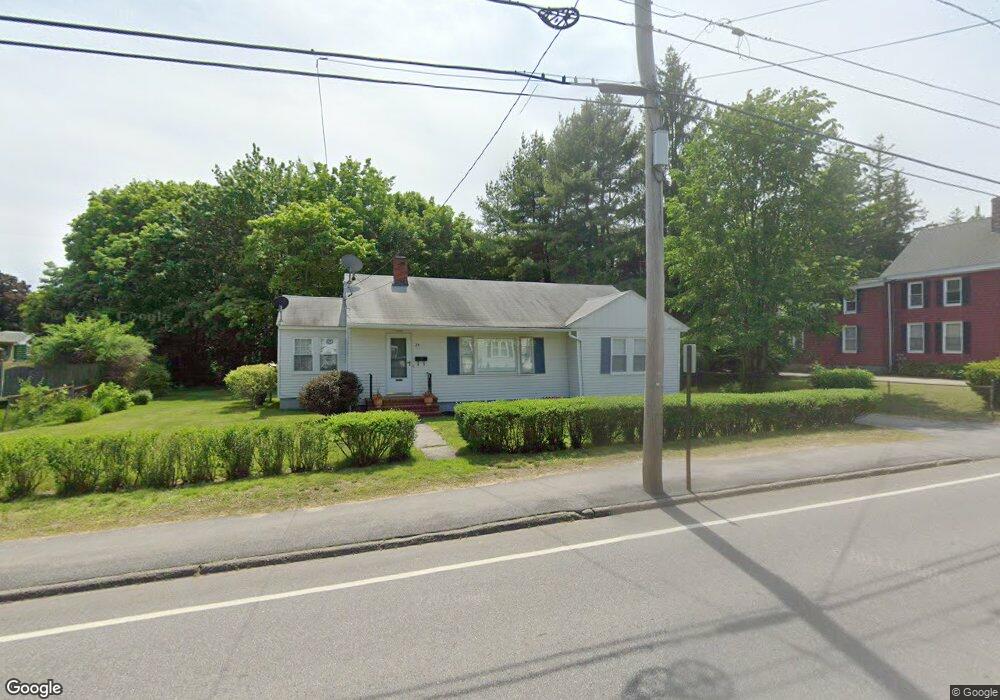
24 West St Biddeford, ME 04005
Estimated Value: $409,000 - $429,123
3
Beds
1
Bath
1,250
Sq Ft
$336/Sq Ft
Est. Value
About This Home
This home is located at 24 West St, Biddeford, ME 04005 and is currently estimated at $420,281, approximately $336 per square foot. 24 West St is a home located in York County with nearby schools including John F Kennedy Memorial School, Biddeford Primary School, and Biddeford Intermediate School.
Ownership History
Date
Name
Owned For
Owner Type
Purchase Details
Closed on
Jul 20, 2012
Sold by
Dubois Rachel Est
Bought by
Casey Greg R and Casey Tammy M
Current Estimated Value
Home Financials for this Owner
Home Financials are based on the most recent Mortgage that was taken out on this home.
Original Mortgage
$152,957
Outstanding Balance
$103,832
Interest Rate
3.7%
Mortgage Type
Purchase Money Mortgage
Estimated Equity
$316,449
Purchase Details
Closed on
Jul 7, 2008
Sold by
Girouard Mark L
Bought by
Girourd Mark L
Create a Home Valuation Report for This Property
The Home Valuation Report is an in-depth analysis detailing your home's value as well as a comparison with similar homes in the area
Home Values in the Area
Average Home Value in this Area
Purchase History
| Date | Buyer | Sale Price | Title Company |
|---|---|---|---|
| Casey Greg R | -- | -- | |
| Girourd Mark L | -- | -- |
Source: Public Records
Mortgage History
| Date | Status | Borrower | Loan Amount |
|---|---|---|---|
| Open | Casey Greg R | $152,957 |
Source: Public Records
Tax History
| Year | Tax Paid | Tax Assessment Tax Assessment Total Assessment is a certain percentage of the fair market value that is determined by local assessors to be the total taxable value of land and additions on the property. | Land | Improvement |
|---|---|---|---|---|
| 2025 | $5,038 | $337,200 | $146,600 | $190,600 |
| 2024 | $4,744 | $333,600 | $146,600 | $187,000 |
| 2023 | $4,343 | $331,000 | $144,000 | $187,000 |
| 2022 | $3,819 | $232,700 | $81,100 | $151,600 |
| 2021 | $3,630 | $199,100 | $68,700 | $130,400 |
| 2020 | $3,667 | $182,900 | $62,400 | $120,500 |
| 2019 | $3,654 | $182,900 | $62,400 | $120,500 |
| 2018 | $3,603 | $182,900 | $62,400 | $120,500 |
| 2017 | $3,372 | $168,000 | $62,400 | $105,600 |
| 2016 | $3,336 | $168,000 | $62,400 | $105,600 |
| 2015 | $3,271 | $168,000 | $62,400 | $105,600 |
| 2014 | $3,190 | $168,000 | $62,400 | $105,600 |
| 2013 | -- | $172,800 | $59,200 | $113,600 |
Source: Public Records
Map
Nearby Homes
Your Personal Tour Guide
Ask me questions while you tour the home.