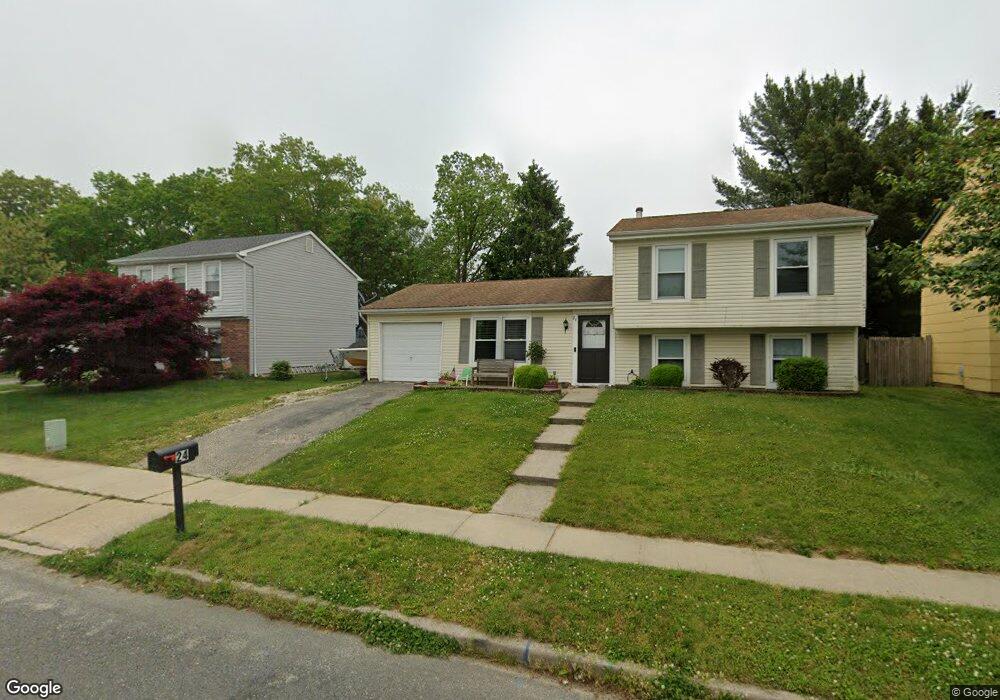
24 Windward Dr Barnegat, NJ 08005
Barnegat Township NeighborhoodEstimated Value: $356,000 - $418,000
3
Beds
2
Baths
1,530
Sq Ft
$256/Sq Ft
Est. Value
About This Home
This home is located at 24 Windward Dr, Barnegat, NJ 08005 and is currently estimated at $392,112, approximately $256 per square foot. 24 Windward Dr is a home located in Ocean County with nearby schools including Barnegat High School and Lighthouse Christian Academy.
Ownership History
Date
Name
Owned For
Owner Type
Purchase Details
Closed on
Oct 20, 2004
Sold by
Paino Vincent and Paino Dorothy A
Bought by
Faulds Shaun and Faulds Allison
Current Estimated Value
Home Financials for this Owner
Home Financials are based on the most recent Mortgage that was taken out on this home.
Original Mortgage
$200,000
Outstanding Balance
$116,508
Interest Rate
5.71%
Mortgage Type
Purchase Money Mortgage
Estimated Equity
$275,604
Create a Home Valuation Report for This Property
The Home Valuation Report is an in-depth analysis detailing your home's value as well as a comparison with similar homes in the area
Home Values in the Area
Average Home Value in this Area
Purchase History
| Date | Buyer | Sale Price | Title Company |
|---|---|---|---|
| Faulds Shaun | $220,000 | First American Title Ins Co |
Source: Public Records
Mortgage History
| Date | Status | Borrower | Loan Amount |
|---|---|---|---|
| Open | Faulds Shaun | $200,000 |
Source: Public Records
Tax History Compared to Growth
Tax History
| Year | Tax Paid | Tax Assessment Tax Assessment Total Assessment is a certain percentage of the fair market value that is determined by local assessors to be the total taxable value of land and additions on the property. | Land | Improvement |
|---|---|---|---|---|
| 2025 | $4,897 | $164,500 | $69,000 | $95,500 |
| 2024 | $4,789 | $164,500 | $69,000 | $95,500 |
| 2023 | $4,634 | $164,500 | $69,000 | $95,500 |
| 2022 | $4,634 | $164,500 | $69,000 | $95,500 |
| 2021 | $4,613 | $164,500 | $69,000 | $95,500 |
| 2020 | $4,591 | $164,500 | $69,000 | $95,500 |
| 2019 | $4,524 | $164,500 | $69,000 | $95,500 |
| 2018 | $4,489 | $164,500 | $69,000 | $95,500 |
| 2017 | $4,415 | $164,500 | $69,000 | $95,500 |
| 2016 | $4,325 | $164,500 | $69,000 | $95,500 |
| 2015 | $4,188 | $164,500 | $69,000 | $95,500 |
| 2014 | $4,081 | $164,500 | $69,000 | $95,500 |
Source: Public Records
Map
Nearby Homes