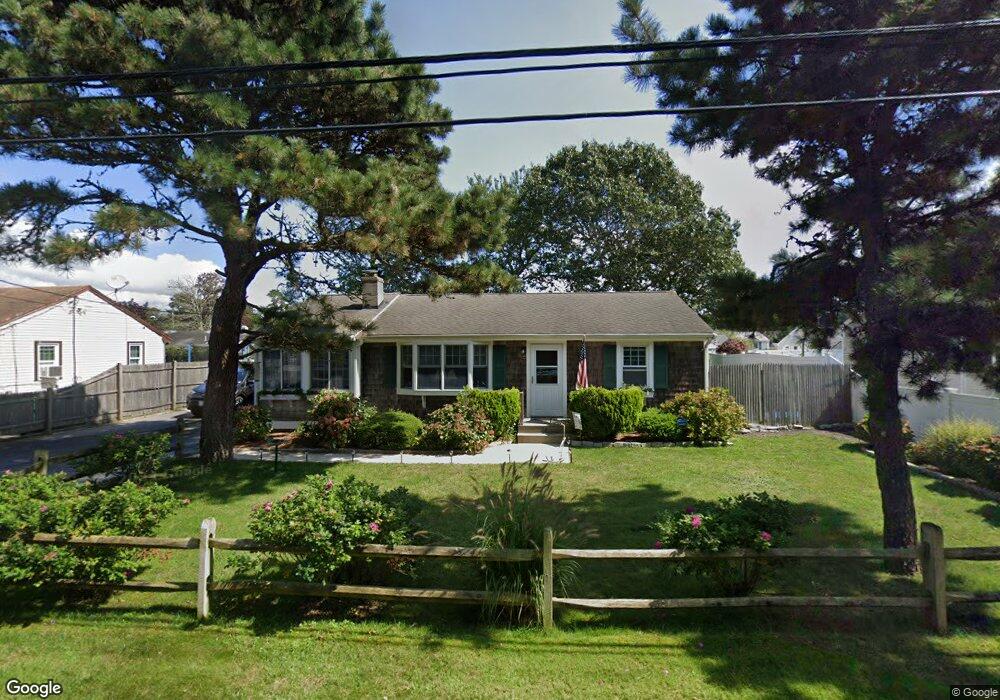
24 Yale Cir Dennis Port, MA 02639
Dennis Port NeighborhoodEstimated Value: $507,000 - $694,000
3
Beds
1
Bath
800
Sq Ft
$766/Sq Ft
Est. Value
About This Home
This home is located at 24 Yale Cir, Dennis Port, MA 02639 and is currently estimated at $612,509, approximately $765 per square foot. 24 Yale Cir is a home located in Barnstable County with nearby schools including Dennis-Yarmouth Regional High School and St. Pius X. School.
Ownership History
Date
Name
Owned For
Owner Type
Purchase Details
Closed on
May 17, 2024
Sold by
Kelly John R and Kelly Margaret L
Bought by
Kelly Irt and Boudreau
Current Estimated Value
Purchase Details
Closed on
Jun 17, 1994
Sold by
Tang Alex Y and Tang Mon Li
Bought by
Kelly John R and Kelly Margaret L
Home Financials for this Owner
Home Financials are based on the most recent Mortgage that was taken out on this home.
Original Mortgage
$74,700
Interest Rate
8.5%
Mortgage Type
Purchase Money Mortgage
Purchase Details
Closed on
Jan 15, 1993
Sold by
Georgian Elefterios J and Georgian Colleen
Bought by
Tang Alex Y and Tang Mon Li
Home Financials for this Owner
Home Financials are based on the most recent Mortgage that was taken out on this home.
Original Mortgage
$63,200
Interest Rate
8.3%
Mortgage Type
Purchase Money Mortgage
Create a Home Valuation Report for This Property
The Home Valuation Report is an in-depth analysis detailing your home's value as well as a comparison with similar homes in the area
Home Values in the Area
Average Home Value in this Area
Purchase History
| Date | Buyer | Sale Price | Title Company |
|---|---|---|---|
| Kelly Irt | -- | None Available | |
| Kelly Irt | -- | None Available | |
| Kelly John R | $83,000 | -- | |
| Tang Alex Y | $97,200 | -- | |
| Kelly John R | $83,000 | -- | |
| Tang Alex Y | $97,200 | -- |
Source: Public Records
Mortgage History
| Date | Status | Borrower | Loan Amount |
|---|---|---|---|
| Previous Owner | Kelly John R | $74,700 | |
| Previous Owner | Tang Alex Y | $63,200 |
Source: Public Records
Tax History Compared to Growth
Tax History
| Year | Tax Paid | Tax Assessment Tax Assessment Total Assessment is a certain percentage of the fair market value that is determined by local assessors to be the total taxable value of land and additions on the property. | Land | Improvement |
|---|---|---|---|---|
| 2025 | $2,350 | $542,800 | $202,200 | $340,600 |
| 2024 | $2,194 | $499,700 | $194,500 | $305,200 |
| 2023 | $2,122 | $454,400 | $176,800 | $277,600 |
| 2022 | $1,984 | $354,300 | $159,300 | $195,000 |
| 2021 | $2,042 | $338,700 | $178,400 | $160,300 |
| 2020 | $1,839 | $301,500 | $156,100 | $145,400 |
| 2019 | $1,740 | $282,000 | $153,100 | $128,900 |
| 2018 | $3,526 | $261,300 | $145,700 | $115,600 |
| 2017 | $1,520 | $247,100 | $135,300 | $111,800 |
| 2016 | $1,568 | $240,100 | $145,700 | $94,400 |
| 2015 | $1,537 | $240,100 | $145,700 | $94,400 |
| 2014 | $1,393 | $219,300 | $124,900 | $94,400 |
Source: Public Records
Map
Nearby Homes
- 19 Standish Way
- 80 Michaels Ave
- 4 Coffey Ln
- 71 Main St
- 125 Main St Unit 3
- 22 Wixon Rd
- 31 Easy St
- 12 Spoonbill Rd
- 72 Bassett Ln
- 15 Woodside Park Rd
- 268 Main St
- 37 Ocean Dr Unit 2
- 95 Center St
- 26 Center St
- 61 Trotters Ln
- 64 Beaten Rd
- 112 Old Wharf Rd Unit E4
- 112 Old Wharf Rd Unit E1
- 3 Pinefield Ln
- 22 Ferncliff Rd