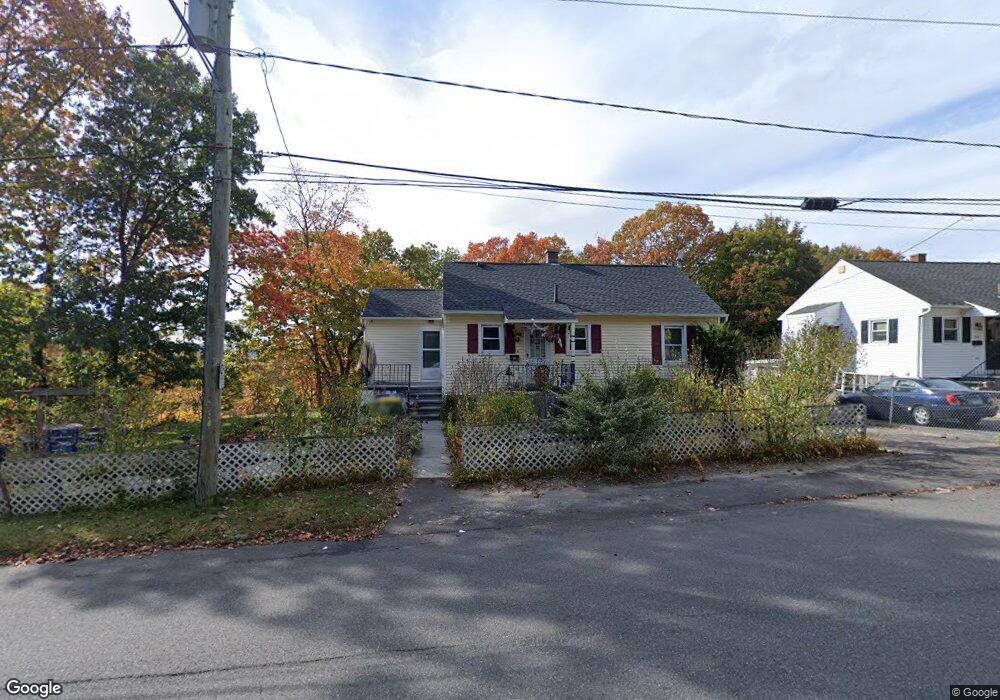
240 Birch St Waterbury, CT 06704
North End District NeighborhoodEstimated Value: $203,000 - $266,000
3
Beds
1
Bath
1,098
Sq Ft
$222/Sq Ft
Est. Value
About This Home
This home is located at 240 Birch St, Waterbury, CT 06704 and is currently estimated at $244,119, approximately $222 per square foot. 240 Birch St is a home located in New Haven County with nearby schools including Woodrow Wilson School, Michael F. Wallace Middle School, and Crosby High School.
Ownership History
Date
Name
Owned For
Owner Type
Purchase Details
Closed on
Oct 29, 2001
Sold by
Haines Stove and Scannapieco Frank
Bought by
Anderson Lilawatie and Anderson Deolall
Current Estimated Value
Purchase Details
Closed on
Dec 24, 1998
Sold by
Scannapieco Melvina N
Bought by
Scannapieco Frank and Scannapieco Cindy
Create a Home Valuation Report for This Property
The Home Valuation Report is an in-depth analysis detailing your home's value as well as a comparison with similar homes in the area
Home Values in the Area
Average Home Value in this Area
Purchase History
| Date | Buyer | Sale Price | Title Company |
|---|---|---|---|
| Anderson Lilawatie | $94,000 | -- | |
| Scannapieco Frank | $72,000 | -- | |
| Anderson Lilawatie | $94,000 | -- | |
| Scannapieco Frank | $72,000 | -- |
Source: Public Records
Mortgage History
| Date | Status | Borrower | Loan Amount |
|---|---|---|---|
| Open | Scannapieco Frank | $17,500 | |
| Open | Scannapieco Frank | $109,585 | |
| Closed | Scannapieco Frank | $76,308 |
Source: Public Records
Tax History Compared to Growth
Tax History
| Year | Tax Paid | Tax Assessment Tax Assessment Total Assessment is a certain percentage of the fair market value that is determined by local assessors to be the total taxable value of land and additions on the property. | Land | Improvement |
|---|---|---|---|---|
| 2025 | $5,390 | $119,840 | $13,580 | $106,260 |
| 2024 | $5,925 | $119,840 | $13,580 | $106,260 |
| 2023 | $6,494 | $119,840 | $13,580 | $106,260 |
| 2022 | $4,095 | $68,020 | $13,580 | $54,440 |
| 2021 | $4,095 | $68,020 | $13,580 | $54,440 |
| 2020 | $4,095 | $68,020 | $13,580 | $54,440 |
| 2019 | $4,095 | $68,020 | $13,580 | $54,440 |
| 2018 | $4,095 | $68,020 | $13,580 | $54,440 |
| 2017 | $4,261 | $70,770 | $13,580 | $57,190 |
| 2016 | $4,261 | $70,770 | $13,580 | $57,190 |
| 2015 | $4,120 | $70,770 | $13,580 | $57,190 |
| 2014 | $4,120 | $70,770 | $13,580 | $57,190 |
Source: Public Records
Map
Nearby Homes