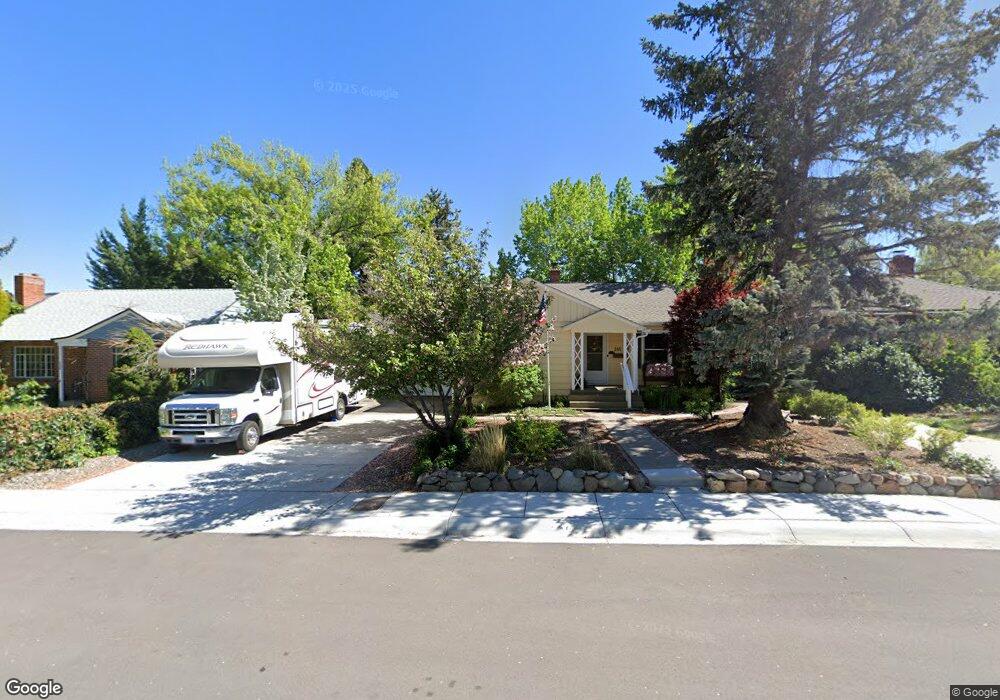
240 Bonnie Briar Place Reno, NV 89509
Virginia Lake NeighborhoodEstimated Value: $599,143 - $767,000
2
Beds
2
Baths
1,720
Sq Ft
$401/Sq Ft
Est. Value
About This Home
This home is located at 240 Bonnie Briar Place, Reno, NV 89509 and is currently estimated at $690,036, approximately $401 per square foot. 240 Bonnie Briar Place is a home located in Washoe County with nearby schools including Jessie Beck Elementary School, Darrell C Swope Middle School, and Reno High School.
Ownership History
Date
Name
Owned For
Owner Type
Purchase Details
Closed on
Sep 12, 2023
Sold by
Macleod Charles E and Macleod Lydia L
Bought by
Macleod Family Trust and Macleod
Current Estimated Value
Purchase Details
Closed on
Nov 5, 2019
Sold by
Macleod Charles E and Macleod Lydia R
Bought by
Macleod Charles E and Macleod Lydia R
Home Financials for this Owner
Home Financials are based on the most recent Mortgage that was taken out on this home.
Original Mortgage
$266,000
Interest Rate
3.6%
Mortgage Type
VA
Purchase Details
Closed on
May 23, 1995
Sold by
Fricke Kathy J
Bought by
Macleod Charles Edwin and Macleod Lydia R
Home Financials for this Owner
Home Financials are based on the most recent Mortgage that was taken out on this home.
Original Mortgage
$174,585
Interest Rate
8.43%
Mortgage Type
Assumption
Create a Home Valuation Report for This Property
The Home Valuation Report is an in-depth analysis detailing your home's value as well as a comparison with similar homes in the area
Home Values in the Area
Average Home Value in this Area
Purchase History
| Date | Buyer | Sale Price | Title Company |
|---|---|---|---|
| Macleod Family Trust | -- | None Listed On Document | |
| Macleod Charles E | -- | Western Title Company | |
| Macleod Charles Edwin | $169,500 | First Centennial Title Co |
Source: Public Records
Mortgage History
| Date | Status | Borrower | Loan Amount |
|---|---|---|---|
| Previous Owner | Macleod Charles E | $266,000 | |
| Previous Owner | Macleod Charles Edwin | $174,585 |
Source: Public Records
Tax History Compared to Growth
Tax History
| Year | Tax Paid | Tax Assessment Tax Assessment Total Assessment is a certain percentage of the fair market value that is determined by local assessors to be the total taxable value of land and additions on the property. | Land | Improvement |
|---|---|---|---|---|
| 2025 | $99 | $89,556 | $53,599 | $35,957 |
| 2024 | $99 | $85,873 | $51,538 | $34,335 |
| 2023 | $98 | $78,543 | $46,982 | $31,561 |
| 2022 | $157 | $65,700 | $39,967 | $25,733 |
| 2021 | $9 | $55,145 | $34,913 | $20,232 |
| 2020 | $6 | $54,767 | $34,913 | $19,854 |
| 2019 | $7 | $50,337 | $31,588 | $18,749 |
| 2018 | $6 | $42,924 | $24,938 | $17,986 |
| 2017 | $464 | $35,978 | $18,321 | $17,657 |
| 2016 | $829 | $34,787 | $17,190 | $17,597 |
| 2015 | $828 | $32,634 | $15,129 | $17,505 |
| 2014 | $805 | $29,507 | $12,934 | $16,573 |
| 2013 | -- | $24,512 | $8,545 | $15,967 |
Source: Public Records
Map
Nearby Homes
- 330 Sunset Dr
- 395 Hillcrest Dr
- 230 Glenmanor Dr
- 2180 Alamo Square Way
- 2330 Sunrise Dr
- 2040 Alamo Square Way
- 225 Gramercy Ln
- 2020 Alamo Square Way
- 421 Glenmanor Dr
- 265 Lafayette Ln
- 2091 S Virginia St
- 2265 Grosvenor Park Place
- 2450 Lymbery St Unit 228
- 2450 Lymbery St Unit 105
- 2450 Lymbery St Unit 113
- 2450 Lymbery St Unit 107
- 2450 Lymbery St Unit 230
- 1633 Knox Ave
- 2750 Plumas St Unit 201
- 2750 Plumas St Unit 109
- 244 Bonnie Briar Place
- 236 Bonnie Briar Place
- 234 Bonnie Briar Place
- 2000 Watt St
- 255 Wildrose Dr
- 2020 Watt St
- 232 Bonnie Briar Place
- 265 Wild Rose Dr
- 275 Bonnie Briar Place
- 2022 Watt St
- 295 Bonnie Briar Place
- 255 Bonnie Briar Place
- 249 Bonnie Briar Place
- 2075 Lakeside Dr
- 235 Wildrose Dr
- 245 Bonnie Briar Place
- 2055 Lakeside Dr
- 2125 Lakeside Dr
- 1980 Watt St
- 275 Wildrose Dr