Estimated Value: $63,000 - $172,000
7
Beds
2
Baths
1,126
Sq Ft
$88/Sq Ft
Est. Value
About This Home
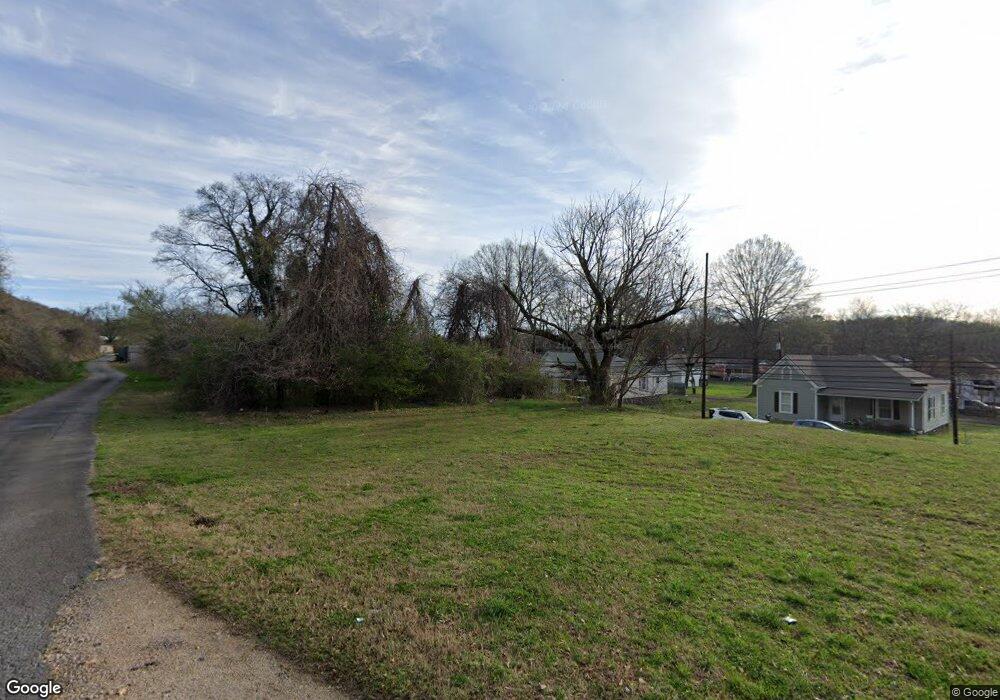
This home is located at 240 Cave Spring St SW, Rome, GA 30161 and is currently estimated at $99,625, approximately $88 per square foot. 240 Cave Spring St SW is a home located in Floyd County with nearby schools including Dan McCarty Middle School, Rome High School, and Darlington School.
Ownership History
Date
Name
Owned For
Owner Type
Purchase Details
Closed on
Nov 7, 2011
Sold by
Greater Rome Bank
Bought by
School Darlington
Current Estimated Value
Purchase Details
Closed on
Jun 3, 2008
Sold by
Not Provided
Bought by
Greater Rome Bank
Purchase Details
Closed on
Jun 2, 2008
Sold by
Duggan Tucker Inc
Bought by
Greater Rome Bank
Purchase Details
Closed on
Apr 9, 2003
Sold by
Duggan Donald R
Bought by
Duggan And Tucker Inc
Purchase Details
Closed on
Jan 17, 2003
Sold by
Hutcheson Radford
Bought by
Duggan Donald R
Purchase Details
Closed on
May 2, 1986
Sold by
Youngblood Earlton B
Bought by
Hutcheson Radford
Purchase Details
Closed on
May 7, 1984
Sold by
Georgia State Bank Of Rome The
Bought by
Youngblood Earlton B
Purchase Details
Closed on
Feb 7, 1984
Sold by
Pressley Ronnie J
Bought by
Georgia State Bank Of Rome The
Purchase Details
Closed on
Nov 17, 1978
Sold by
Clemones Wm M
Bought by
Pressley Ronnie J
Purchase Details
Closed on
Mar 8, 1963
Bought by
Clemones Wm M
Create a Home Valuation Report for This Property
The Home Valuation Report is an in-depth analysis detailing your home's value as well as a comparison with similar homes in the area
Home Values in the Area
Average Home Value in this Area
Purchase History
| Date | Buyer | Sale Price | Title Company |
|---|---|---|---|
| School Darlington | -- | -- | |
| Greater Rome Bank | $31,618 | -- | |
| Greater Rome Bank | -- | -- | |
| Duggan And Tucker Inc | $5,000 | -- | |
| Duggan Donald R | $20,000 | -- | |
| Hutcheson Radford | -- | -- | |
| Youngblood Earlton B | $5,000 | -- | |
| Georgia State Bank Of Rome The | $4,500 | -- | |
| Pressley Ronnie J | $4,300 | -- | |
| Clemones Wm M | -- | -- |
Source: Public Records
Tax History Compared to Growth
Tax History
| Year | Tax Paid | Tax Assessment Tax Assessment Total Assessment is a certain percentage of the fair market value that is determined by local assessors to be the total taxable value of land and additions on the property. | Land | Improvement |
|---|---|---|---|---|
| 2024 | $861 | $22,004 | $4,488 | $17,516 |
| 2023 | $779 | $20,791 | $4,080 | $16,711 |
| 2022 | $342 | $9,384 | $3,264 | $6,120 |
| 2021 | $303 | $8,166 | $3,264 | $4,902 |
| 2020 | $267 | $7,128 | $2,550 | $4,578 |
| 2019 | $252 | $6,798 | $2,550 | $4,248 |
| 2018 | $229 | $6,198 | $2,550 | $3,648 |
| 2017 | $223 | $6,024 | $2,550 | $3,474 |
| 2016 | $202 | $5,438 | $2,520 | $2,918 |
| 2015 | $191 | $5,438 | $2,520 | $2,918 |
| 2014 | $191 | $5,438 | $2,520 | $2,918 |
Source: Public Records
Map
Nearby Homes
- 316 S McLin St SW
- 106 E 14th St SW
- 5 Jervis St SW
- 13 N Blanche Ave SW
- 39 E 16th St SW
- 2 E 10th St SW
- 11 Blacks Bluff Rd SW
- 000 E Oglethorpe Hwy
- 1901 Hull Ave SW
- 166 E 11th St SW
- 164 E 11th St SE
- 168 E 11th St SE
- 111 Lookout Cir SW
- 25 Blacks Bluff Rd SW
- 113 Lookout Cir SW
- 529 Branham Ave SW
- 162 E 11th St SE
- 170 E 11th St SW
- 115 Lookout Cir SW
- 238 Cave Spring St SW
- 292 Cave Spring St SW
- 292 Cave Spring St SW
- 292 Cave Spring St SW
- 292 Cave Spring St SW
- 292 Cave Spring St SW
- 292 Cave Spring St SW
- 292 Cave Spring St SW
- 236 Cave Spring St SW
- 234 Cave Spring St SW
- 239 Cave Spring St SW
- 237 Cave Spring St SW
- 241 Cave Spring St SW
- 235 Cave Spring St SW
- 232 Cave Spring St SW
- 243 Cave Spring St SW
- 233 Cave Spring St SW
- 245 Cave Spring St SW
- 230 Cave Spring St SW
- 231 Cave Spring St SW