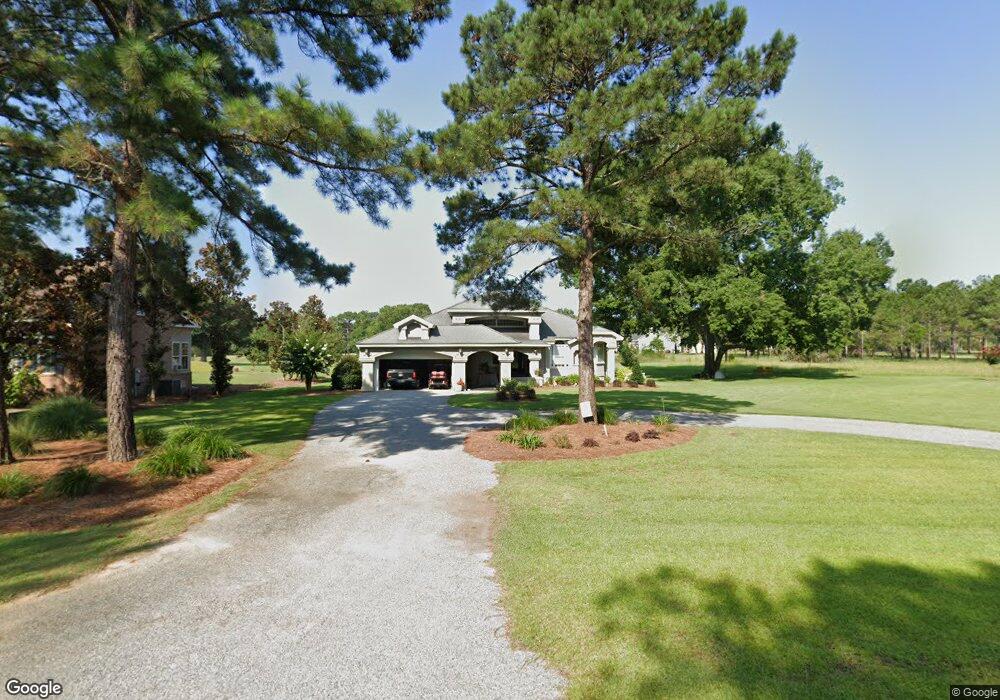
240 Cedar Point Cir Cordele, GA 31015
Estimated Value: $551,000 - $636,376
3
Beds
3
Baths
2,444
Sq Ft
$248/Sq Ft
Est. Value
About This Home
This home is located at 240 Cedar Point Cir, Cordele, GA 31015 and is currently estimated at $606,344, approximately $248 per square foot. 240 Cedar Point Cir is a home located in Crisp County with nearby schools including Crisp County Elementary School, Crisp County Primary School, and Crisp County Middle School.
Ownership History
Date
Name
Owned For
Owner Type
Purchase Details
Closed on
Aug 2, 2019
Sold by
Purser Thomas H
Bought by
Cape Danny Steven
Current Estimated Value
Home Financials for this Owner
Home Financials are based on the most recent Mortgage that was taken out on this home.
Original Mortgage
$145,000
Outstanding Balance
$90,247
Interest Rate
3.7%
Mortgage Type
New Conventional
Estimated Equity
$516,097
Purchase Details
Closed on
Aug 2, 2016
Bought by
Purser Thomas H and Purser Jennifer C
Home Financials for this Owner
Home Financials are based on the most recent Mortgage that was taken out on this home.
Original Mortgage
$280,330
Interest Rate
3.41%
Mortgage Type
New Conventional
Purchase Details
Closed on
Jul 29, 2010
Sold by
Smith Andy
Bought by
Wilcox County State Bank
Purchase Details
Closed on
Aug 16, 2007
Sold by
Hoover Lynn E
Bought by
Smith Andy
Purchase Details
Closed on
May 10, 2004
Sold by
Whelchel
Bought by
Hoover Lynn E and Hoover Andrea L
Create a Home Valuation Report for This Property
The Home Valuation Report is an in-depth analysis detailing your home's value as well as a comparison with similar homes in the area
Purchase History
| Date | Buyer | Sale Price | Title Company |
|---|---|---|---|
| Cape Danny Steven | $295,000 | -- | |
| Purser Thomas H | $289,000 | -- | |
| Wilcox County State Bank | -- | -- | |
| Smith Andy | $120,300 | -- | |
| Hoover Lynn E | $90,000 | -- |
Source: Public Records
Mortgage History
| Date | Status | Borrower | Loan Amount |
|---|---|---|---|
| Open | Cape Danny Steven | $145,000 | |
| Previous Owner | Purser Thomas H | $280,330 |
Source: Public Records
Tax History
| Year | Tax Paid | Tax Assessment Tax Assessment Total Assessment is a certain percentage of the fair market value that is determined by local assessors to be the total taxable value of land and additions on the property. | Land | Improvement |
|---|---|---|---|---|
| 2025 | $5,655 | $222,085 | $32,013 | $190,072 |
| 2024 | $5,576 | $207,935 | $32,013 | $175,922 |
| 2023 | $4,260 | $153,681 | $24,010 | $129,671 |
| 2022 | $4,134 | $149,216 | $24,010 | $125,206 |
| 2021 | $3,758 | $126,740 | $24,010 | $102,730 |
| 2020 | $3,445 | $126,740 | $24,010 | $102,730 |
| 2019 | $3,740 | $126,740 | $24,010 | $102,730 |
| 2018 | $4,541 | $148,299 | $56,542 | $91,757 |
| 2017 | $4,560 | $148,299 | $56,542 | $91,757 |
| 2016 | $4,554 | $148,299 | $56,542 | $91,757 |
| 2015 | -- | $148,300 | $56,542 | $91,757 |
| 2014 | -- | $148,300 | $56,542 | $91,757 |
| 2013 | -- | $148,299 | $56,542 | $91,757 |
Source: Public Records
Map
Nearby Homes
- 228 Cedar Point Cir
- 475 N Cedar Creek Rd
- 141 Landing Rd
- 147 Landing Rd
- 153 Landing Rd
- 251 N Cedar Creek Rd
- 0 Lot #3 & Part Lot#4 Unit 59461
- 119 Wolfs Thick Rd
- 687 Flintside Dr
- 850 Scenic Route
- 103 Cedar Slough Ct
- 0 Cork Ferry Rd
- 415 Cork Ferry Rd
- 629 Cork Ferry Rd
- 655 Flintside Dr
- 631 Flintside Dr
- 111 Cedar Creek Rd S
- Lot 1, 2 Scenic Route
- 580 Scenic Route
- Lot 3,4 Scenic Route
- 246 Cedar Point Cir
- lot 21 Cedar Point Cir
- 103 Harbor Ln
- 137 Harbor Ln
- 145 Harbor Ln
- 208 Cedar Point Cir
- lot 21 NW Cedar Point Add II Cedar Point Dr
- 120 Harbor Ln
- 19 Cedar Point Dr
- 28 Harbor Ln
- 0 Harbor Ln Unit 10158
- 0 S Cedar Point Cir
- 200 Cedar Point Cir
- 174 Cedar Point Cir
- 198 Cedar Point Cir
- 196 Cedar Point Cir
- 186 Cedar Point Cir
- 178 Cedar Point Cir
- 142 Cedar Point Cr
- 142 Cedar Point Cir
Your Personal Tour Guide
Ask me questions while you tour the home.