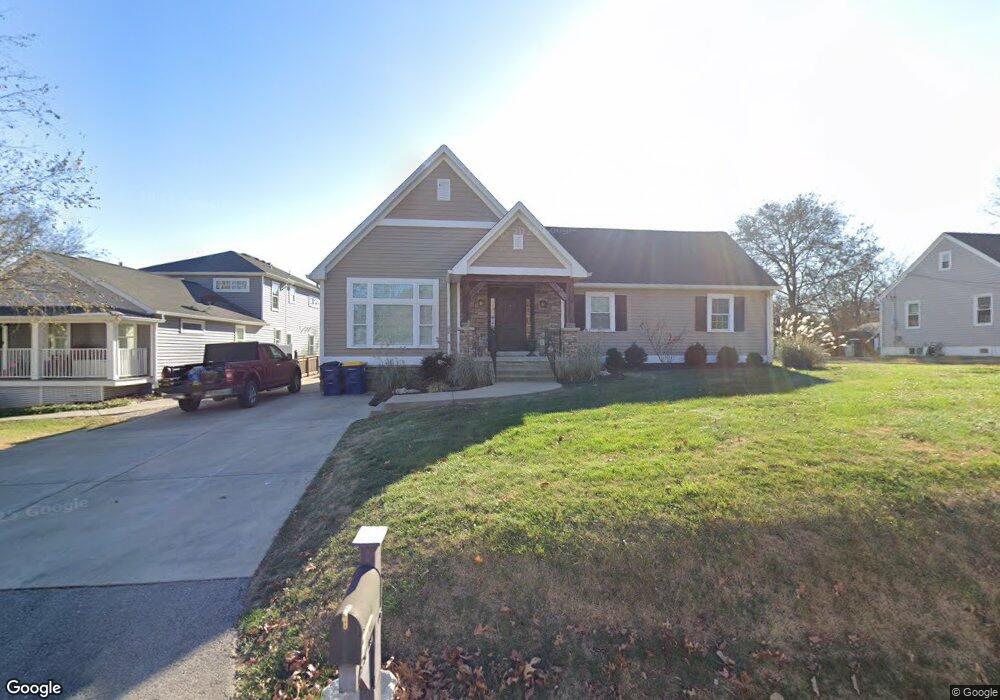
240 Cliff Cave Rd Saint Louis, MO 63129
Estimated Value: $319,000 - $377,000
5
Beds
1
Bath
2,320
Sq Ft
$152/Sq Ft
Est. Value
About This Home
This home is located at 240 Cliff Cave Rd, Saint Louis, MO 63129 and is currently estimated at $353,344, approximately $152 per square foot. 240 Cliff Cave Rd is a home located in St. Louis County with nearby schools including Wohlwend Elementary School, Oakville Middle School, and Oakville Senior High School.
Ownership History
Date
Name
Owned For
Owner Type
Purchase Details
Closed on
Jun 15, 2023
Sold by
Markway Matthew N and Markway Trisha L
Bought by
Markway Matthew N and Markway Trisha L
Current Estimated Value
Home Financials for this Owner
Home Financials are based on the most recent Mortgage that was taken out on this home.
Original Mortgage
$456,200
Outstanding Balance
$445,561
Interest Rate
7.13%
Mortgage Type
New Conventional
Estimated Equity
-$92,217
Purchase Details
Closed on
Sep 12, 2003
Sold by
Weitzel Richard and Weitzel Margaret
Bought by
Markway Matthew N and Markway Trish
Home Financials for this Owner
Home Financials are based on the most recent Mortgage that was taken out on this home.
Original Mortgage
$78,160
Interest Rate
7.5%
Mortgage Type
Purchase Money Mortgage
Purchase Details
Closed on
Jun 15, 2000
Sold by
Richard Weitzel
Bought by
Weitzel Margaret A
Create a Home Valuation Report for This Property
The Home Valuation Report is an in-depth analysis detailing your home's value as well as a comparison with similar homes in the area
Home Values in the Area
Average Home Value in this Area
Purchase History
| Date | Buyer | Sale Price | Title Company |
|---|---|---|---|
| Markway Matthew N | -- | None Listed On Document | |
| Markway Matthew N | $98,200 | -- | |
| Weitzel Margaret A | -- | -- |
Source: Public Records
Mortgage History
| Date | Status | Borrower | Loan Amount |
|---|---|---|---|
| Open | Markway Matthew N | $456,200 | |
| Previous Owner | Markway Matthew N | $78,160 |
Source: Public Records
Tax History Compared to Growth
Tax History
| Year | Tax Paid | Tax Assessment Tax Assessment Total Assessment is a certain percentage of the fair market value that is determined by local assessors to be the total taxable value of land and additions on the property. | Land | Improvement |
|---|---|---|---|---|
| 2025 | $3,734 | $66,730 | $17,500 | $49,230 |
| 2024 | $3,734 | $55,580 | $11,670 | $43,910 |
| 2023 | $3,686 | $55,580 | $11,670 | $43,910 |
| 2022 | $1,766 | $26,550 | $11,670 | $14,880 |
| 2021 | $1,709 | $26,550 | $11,670 | $14,880 |
| 2020 | $1,830 | $27,060 | $10,850 | $16,210 |
| 2019 | $1,824 | $27,060 | $10,850 | $16,210 |
| 2018 | $1,555 | $20,770 | $8,990 | $11,780 |
| 2017 | $1,553 | $20,770 | $8,990 | $11,780 |
| 2016 | $1,601 | $20,560 | $8,130 | $12,430 |
| 2015 | $1,471 | $20,560 | $8,130 | $12,430 |
| 2014 | $1,418 | $19,610 | $4,140 | $15,470 |
Source: Public Records
Map
Nearby Homes
- 2408 Whitshire Dr
- 5709 Chatport Rd
- 2304 Glenrich Dr
- 5501 Dober Ln
- 2379 England Town Rd
- 5427 Alnwick Dr
- 2552 Coppergate Square Dr
- 2177 Aileswick Dr
- 2578 Coppergate Square Dr Unit 3B
- 179 Tel Haven Ct
- 236 Tapestry Dr
- 116 Pioneer Dr
- 5405 Edelweis Ln
- 4555 Burncoate Dr
- 2526 Cathedral Dr
- 2821 Waldwick Ct
- 141 Stallard Ln
- 2766 Chalet Hill Dr
- 4460 Telegraph Rd
- 5810 Flaming Leaf Ct
- 234 Cliff Cave Rd
- 246 Cliff Cave Rd
- 5541 Steele Ridge Rd
- 260 Cliff Cave Rd
- 5536 Steele Ridge Rd
- 5562 Remington Villas Ct
- 222 Cliff Cave Rd
- 5558 Remington Villas Ct
- 5533 Steele Ridge Rd
- 2355 Hempline Ct
- 2351 Hempline Ct
- 300 Cliff Cave Rd
- 2359 Hempline Ct
- 5554 Remington Villas Ct
- 2347 Hempline Ct
- 2363 Hempline Ct
- 305 Cliff Cave Rd
- 208 Cliff Cave Rd
- 2343 Hempline Ct
- 2367 Hempline Ct