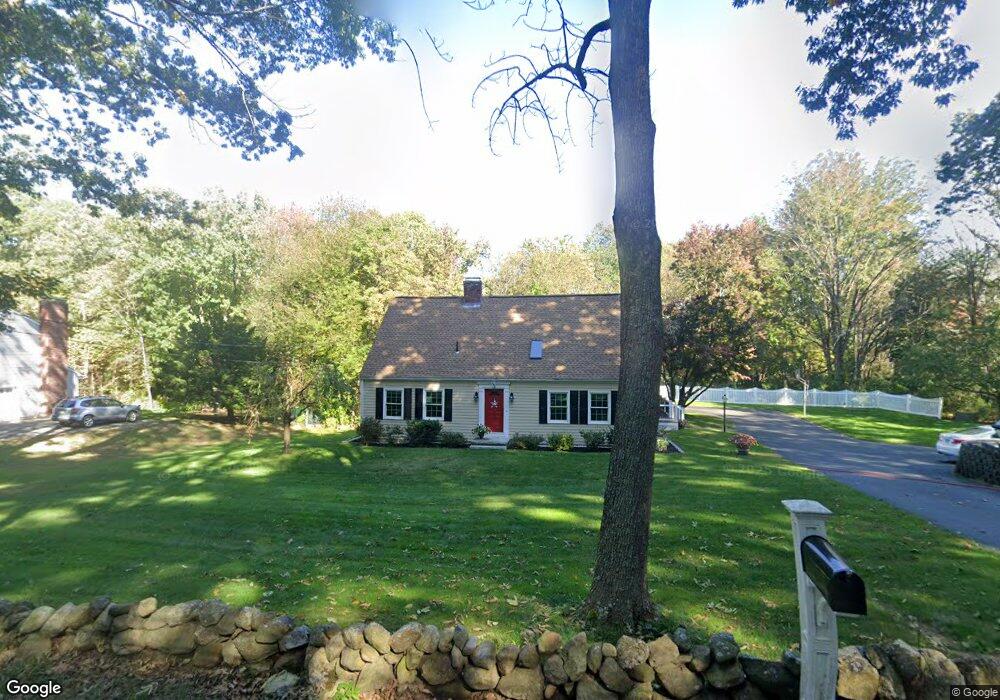
240 Farnum St North Andover, MA 01845
Estimated Value: $816,007 - $958,000
4
Beds
2
Baths
2,602
Sq Ft
$350/Sq Ft
Est. Value
About This Home
This home is located at 240 Farnum St, North Andover, MA 01845 and is currently estimated at $911,252, approximately $350 per square foot. 240 Farnum St is a home located in Essex County with nearby schools including Annie L Sargent Elementary School, North Andover Middle School, and North Andover High School.
Ownership History
Date
Name
Owned For
Owner Type
Purchase Details
Closed on
May 17, 2006
Sold by
Gulezian Robert P
Bought by
Fowney Elizabeth and Fowney Sean
Current Estimated Value
Home Financials for this Owner
Home Financials are based on the most recent Mortgage that was taken out on this home.
Original Mortgage
$410,000
Outstanding Balance
$237,726
Interest Rate
6.42%
Mortgage Type
Purchase Money Mortgage
Estimated Equity
$673,526
Create a Home Valuation Report for This Property
The Home Valuation Report is an in-depth analysis detailing your home's value as well as a comparison with similar homes in the area
Home Values in the Area
Average Home Value in this Area
Purchase History
| Date | Buyer | Sale Price | Title Company |
|---|---|---|---|
| Fowney Elizabeth | $512,500 | -- |
Source: Public Records
Mortgage History
| Date | Status | Borrower | Loan Amount |
|---|---|---|---|
| Open | Fowney Elizabeth | $410,000 |
Source: Public Records
Tax History Compared to Growth
Tax History
| Year | Tax Paid | Tax Assessment Tax Assessment Total Assessment is a certain percentage of the fair market value that is determined by local assessors to be the total taxable value of land and additions on the property. | Land | Improvement |
|---|---|---|---|---|
| 2025 | $7,831 | $695,500 | $370,900 | $324,600 |
| 2024 | $7,586 | $684,000 | $349,100 | $334,900 |
| 2023 | $7,475 | $610,700 | $320,700 | $290,000 |
| 2022 | $7,412 | $547,800 | $288,000 | $259,800 |
| 2021 | $7,392 | $521,700 | $261,900 | $259,800 |
| 2020 | $7,027 | $511,400 | $261,900 | $249,500 |
| 2019 | $6,858 | $511,400 | $261,900 | $249,500 |
| 2018 | $7,431 | $511,400 | $261,900 | $249,500 |
| 2017 | $6,893 | $482,700 | $207,300 | $275,400 |
| 2016 | $6,777 | $474,900 | $203,400 | $271,500 |
| 2015 | $6,510 | $452,400 | $200,100 | $252,300 |
Source: Public Records
Map
Nearby Homes
- 10 Woodchuck Ln
- 12 Farnum St
- 7 Sullivan St
- 45 Thistle Rd
- 495 Johnson St
- 75 Thistle Rd
- 378 Salem St
- 124 Hillside Rd
- 76 Hillside Rd
- 204 Chestnut St
- 8 Athena Cir
- 80 Sandra Ln
- 133B Salem
- 104 Salem St
- Lot 10 Stonecleave Rd
- 114 Stonecleave Rd
- 53 Salem St
- 174 Chestnut St Unit 14
- 124 Quail Run Rd
- 136 Quail Run Rd
- 230 Farnum St
- 250 Farnum St
- 67 Raleigh Tavern Ln
- 93 Raleigh Tavern Ln
- 55 Raleigh Tavern Ln
- 235 Farnum St
- 270 Farnum St
- 221 Farnum St
- 210 Farnum St
- 17 Raleigh Tavern Ln
- 280 Farnum St
- 70 Raleigh Tavern Ln
- 207 Farnum St
- 100 Raleigh Tavern Ln
- 277 Farnum St
- 46 Raleigh Tavern Ln
- 417 Raleigh Tavern Ln
- 195 Farnum St
- 109 Raleigh Tavern Ln
- 385 Raleigh Tavern Ln