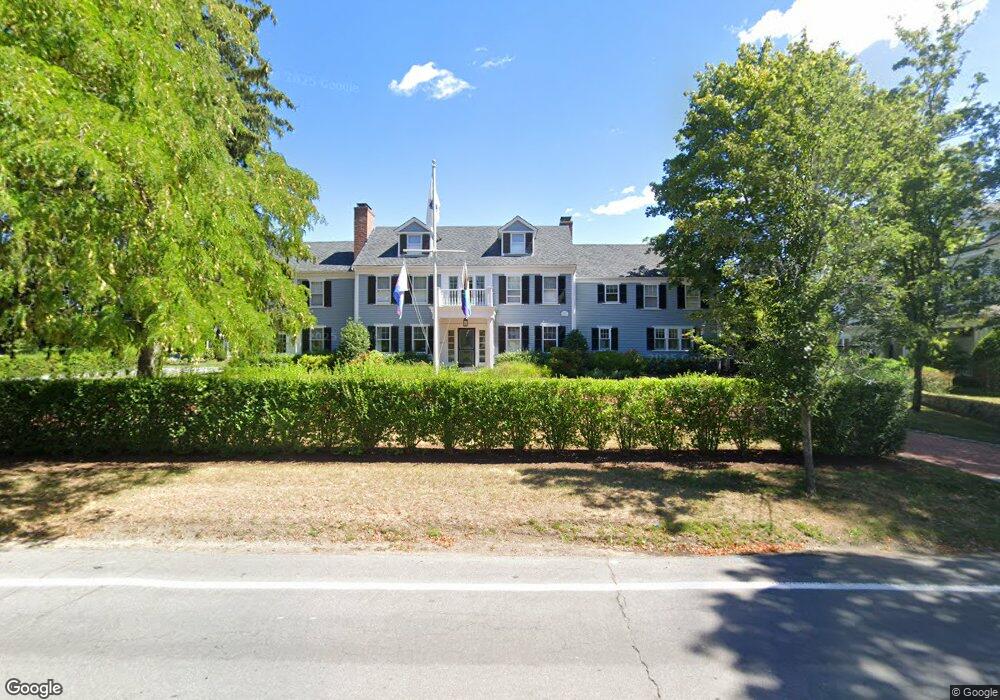
240 Main St Hingham, MA 02043
Estimated Value: $3,534,000 - $4,335,000
7
Beds
7
Baths
6,024
Sq Ft
$645/Sq Ft
Est. Value
About This Home
This home is located at 240 Main St, Hingham, MA 02043 and is currently estimated at $3,883,146, approximately $644 per square foot. 240 Main St is a home located in Plymouth County with nearby schools including East Elementary School, Hingham Middle School, and Hingham High School.
Ownership History
Date
Name
Owned For
Owner Type
Purchase Details
Closed on
Jul 3, 2025
Sold by
Jones Julie H and Jones Mark K
Bought by
Mark K Jones Ret and Jones
Current Estimated Value
Purchase Details
Closed on
Jul 30, 2010
Sold by
Wheeler Andrew C and Wheeler Mary E
Bought by
Jones Julie H and Jones Mark K
Home Financials for this Owner
Home Financials are based on the most recent Mortgage that was taken out on this home.
Original Mortgage
$1,100,000
Interest Rate
4.78%
Mortgage Type
Purchase Money Mortgage
Purchase Details
Closed on
Sep 27, 2000
Sold by
Lamb Thomas J and Allinson Deborah
Bought by
Wheeler Andrew C and Wheeler Mary E
Create a Home Valuation Report for This Property
The Home Valuation Report is an in-depth analysis detailing your home's value as well as a comparison with similar homes in the area
Purchase History
| Date | Buyer | Sale Price | Title Company |
|---|---|---|---|
| Mark K Jones Ret | -- | -- | |
| Mark K Jones Ret | -- | -- | |
| Jones Julie H | $1,885,000 | -- | |
| Jones Julie H | $1,885,000 | -- | |
| Wheeler Andrew C | $985,000 | -- | |
| Wheeler Andrew C | $985,000 | -- |
Source: Public Records
Mortgage History
| Date | Status | Borrower | Loan Amount |
|---|---|---|---|
| Previous Owner | Wheeler Andrew C | $950,000 | |
| Previous Owner | Jones Julie H | $1,100,000 |
Source: Public Records
Tax History
| Year | Tax Paid | Tax Assessment Tax Assessment Total Assessment is a certain percentage of the fair market value that is determined by local assessors to be the total taxable value of land and additions on the property. | Land | Improvement |
|---|---|---|---|---|
| 2025 | $32,464 | $3,036,900 | $848,400 | $2,188,500 |
| 2024 | $32,436 | $2,989,500 | $848,400 | $2,141,100 |
| 2023 | $29,232 | $2,923,200 | $848,400 | $2,074,800 |
| 2022 | $28,662 | $2,479,400 | $771,100 | $1,708,300 |
| 2021 | $27,173 | $2,302,800 | $728,300 | $1,574,500 |
| 2020 | $5,702 | $2,054,600 | $728,300 | $1,326,300 |
| 2019 | $5,526 | $2,032,100 | $728,300 | $1,303,800 |
| 2018 | $23,476 | $1,994,600 | $728,300 | $1,266,300 |
| 2017 | $23,508 | $1,919,000 | $771,100 | $1,147,900 |
| 2016 | $22,382 | $1,792,000 | $734,100 | $1,057,900 |
| 2015 | $21,762 | $1,736,800 | $678,900 | $1,057,900 |
Source: Public Records
Map
Nearby Homes
Your Personal Tour Guide
Ask me questions while you tour the home.