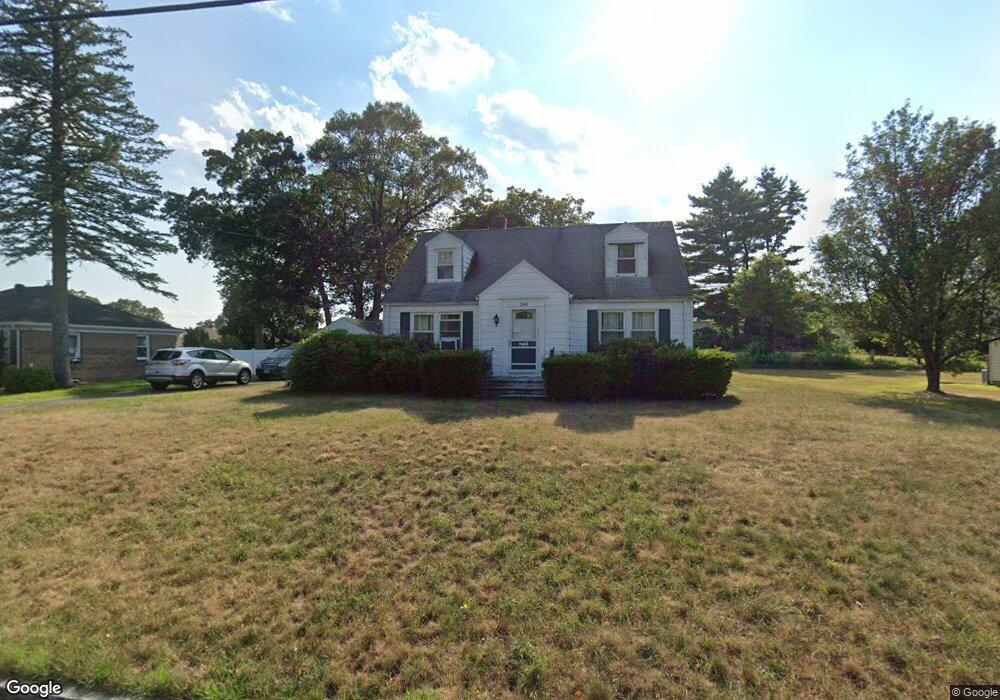
240 Moore St Chicopee, MA 01013
Chicopee Center NeighborhoodEstimated Value: $276,000 - $323,000
4
Beds
1
Bath
1,333
Sq Ft
$229/Sq Ft
Est. Value
About This Home
This home is located at 240 Moore St, Chicopee, MA 01013 and is currently estimated at $305,806, approximately $229 per square foot. 240 Moore St is a home located in Hampden County with nearby schools including Bowe Elementary School, Fairview Middle School, and Chicopee High School.
Ownership History
Date
Name
Owned For
Owner Type
Purchase Details
Closed on
Jul 10, 2007
Sold by
Sherrin Stephen E and Sherrin Tammy L
Bought by
Riley Dennis W and Riley Stacy L
Current Estimated Value
Home Financials for this Owner
Home Financials are based on the most recent Mortgage that was taken out on this home.
Original Mortgage
$139,000
Outstanding Balance
$86,379
Interest Rate
6.39%
Mortgage Type
Purchase Money Mortgage
Estimated Equity
$219,427
Purchase Details
Closed on
Jul 7, 2006
Sold by
Kapinos Frances and Miller Jane
Bought by
Sherrin Stephen E and Sherrin Tammy L
Home Financials for this Owner
Home Financials are based on the most recent Mortgage that was taken out on this home.
Original Mortgage
$120,000
Interest Rate
6.6%
Mortgage Type
Purchase Money Mortgage
Purchase Details
Closed on
Dec 14, 2004
Sold by
Winiarski Edward F
Bought by
Kapinos Frances and Miller Jane
Create a Home Valuation Report for This Property
The Home Valuation Report is an in-depth analysis detailing your home's value as well as a comparison with similar homes in the area
Home Values in the Area
Average Home Value in this Area
Purchase History
| Date | Buyer | Sale Price | Title Company |
|---|---|---|---|
| Riley Dennis W | $179,000 | -- | |
| Sherrin Stephen E | $150,000 | -- | |
| Kapinos Frances | -- | -- |
Source: Public Records
Mortgage History
| Date | Status | Borrower | Loan Amount |
|---|---|---|---|
| Open | Riley Dennis W | $139,000 | |
| Previous Owner | Sherrin Stephen E | $120,000 |
Source: Public Records
Tax History
| Year | Tax Paid | Tax Assessment Tax Assessment Total Assessment is a certain percentage of the fair market value that is determined by local assessors to be the total taxable value of land and additions on the property. | Land | Improvement |
|---|---|---|---|---|
| 2025 | $3,893 | $256,800 | $107,000 | $149,800 |
| 2024 | $3,696 | $250,400 | $105,000 | $145,400 |
| 2023 | $3,531 | $233,100 | $95,500 | $137,600 |
| 2022 | $3,457 | $203,500 | $83,000 | $120,500 |
| 2021 | $3,038 | $185,700 | $75,500 | $110,200 |
| 2020 | $3,124 | $178,900 | $75,500 | $103,400 |
| 2019 | $2,953 | $172,000 | $75,500 | $96,500 |
| 2018 | $2,845 | $163,900 | $71,900 | $92,000 |
| 2017 | $2,960 | $171,000 | $71,900 | $99,100 |
| 2016 | $2,892 | $171,000 | $71,900 | $99,100 |
| 2015 | $2,913 | $166,100 | $71,900 | $94,200 |
| 2014 | $1,457 | $166,100 | $71,900 | $94,200 |
Source: Public Records
Map
Nearby Homes
- 2 Marion St
- Lot 1 Marion St
- 1078 Liberty St
- 85 Orchard St
- 57- 59 Stearns Terrace
- 103 Ontario St
- 15 Hyde Ave
- 491-493 Newbury St
- 118 Wait St
- 69 Beston St
- 59 Piedmont St
- 13 Beston St
- 35 Lower Grape St
- 27 Parallel St
- 744-746 Carew St
- 27 Abbey St
- 708-710 Carew St
- 774-776 Liberty St
- 0 School St
- 151 Littleton St
Your Personal Tour Guide
Ask me questions while you tour the home.