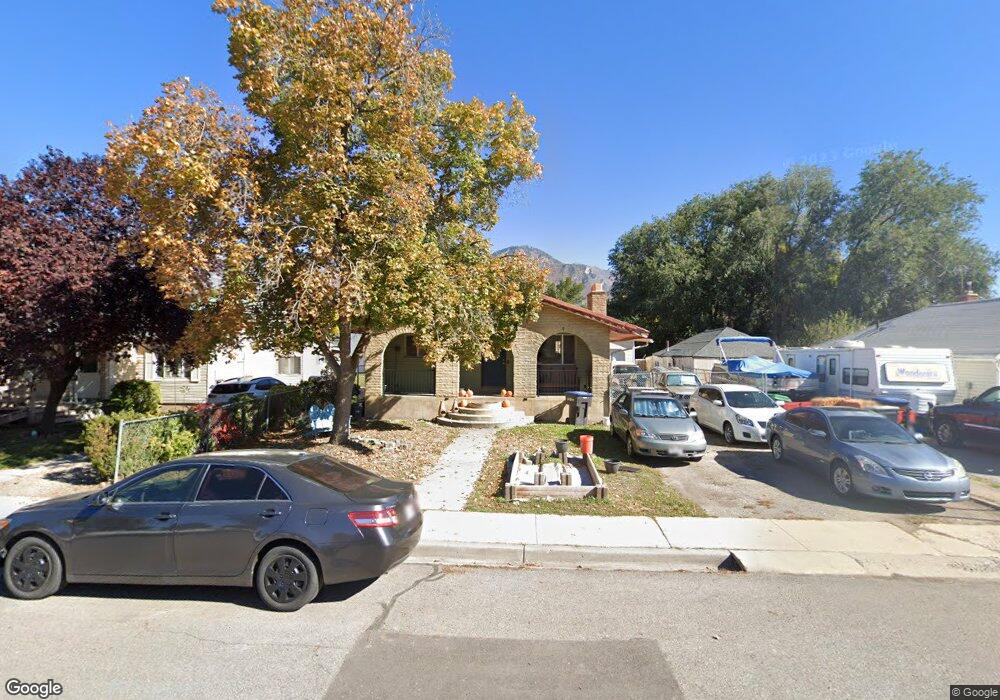
240 N 1000 W Provo, UT 84601
Rivergrove NeighborhoodEstimated Value: $487,000 - $543,505
5
Beds
3
Baths
2,668
Sq Ft
$193/Sq Ft
Est. Value
About This Home
This home is located at 240 N 1000 W, Provo, UT 84601 and is currently estimated at $514,626, approximately $192 per square foot. 240 N 1000 W is a home located in Utah County with nearby schools including Timpanogos Elementary School, Dixon Middle School, and Provo High School.
Ownership History
Date
Name
Owned For
Owner Type
Purchase Details
Closed on
Aug 1, 2024
Sold by
Namba Keisha
Bought by
Namba Revocable Trust and Namba
Current Estimated Value
Purchase Details
Closed on
Jan 30, 2012
Sold by
Fannie Mae
Bought by
Namba Keisha
Home Financials for this Owner
Home Financials are based on the most recent Mortgage that was taken out on this home.
Original Mortgage
$107,503
Interest Rate
4.25%
Mortgage Type
FHA
Purchase Details
Closed on
Jul 26, 2011
Sold by
Larkin Dominic M and Larkin Deirdre Larkin
Bought by
Federal National Mortgage Association
Purchase Details
Closed on
Nov 16, 2005
Sold by
Larkin Dominic M and Larkin Deirdre
Bought by
Domde Properties Llc
Create a Home Valuation Report for This Property
The Home Valuation Report is an in-depth analysis detailing your home's value as well as a comparison with similar homes in the area
Home Values in the Area
Average Home Value in this Area
Purchase History
| Date | Buyer | Sale Price | Title Company |
|---|---|---|---|
| Namba Revocable Trust | -- | None Listed On Document | |
| Namba Keisha | -- | Empire Land Title Inc | |
| Federal National Mortgage Association | $146,450 | None Available | |
| Domde Properties Llc | -- | -- |
Source: Public Records
Mortgage History
| Date | Status | Borrower | Loan Amount |
|---|---|---|---|
| Previous Owner | Namba Keisha | $107,503 |
Source: Public Records
Tax History Compared to Growth
Tax History
| Year | Tax Paid | Tax Assessment Tax Assessment Total Assessment is a certain percentage of the fair market value that is determined by local assessors to be the total taxable value of land and additions on the property. | Land | Improvement |
|---|---|---|---|---|
| 2025 | $2,412 | $270,710 | $144,400 | $347,800 |
| 2024 | $2,412 | $237,435 | $0 | $0 |
| 2023 | $2,354 | $228,470 | $0 | $0 |
| 2022 | $2,535 | $247,995 | $0 | $0 |
| 2021 | $1,963 | $335,000 | $91,600 | $243,400 |
| 2020 | $1,904 | $304,600 | $83,300 | $221,300 |
| 2019 | $1,822 | $303,100 | $83,300 | $219,800 |
| 2018 | $1,684 | $284,200 | $79,900 | $204,300 |
| 2017 | $1,499 | $138,985 | $0 | $0 |
| 2016 | $1,279 | $110,495 | $0 | $0 |
| 2015 | $1,135 | $99,165 | $0 | $0 |
| 2014 | $989 | $90,090 | $0 | $0 |
Source: Public Records
Map
Nearby Homes