Estimated Value: $393,000 - $496,000
Studio
--
Bath
1,308
Sq Ft
$350/Sq Ft
Est. Value
About This Home
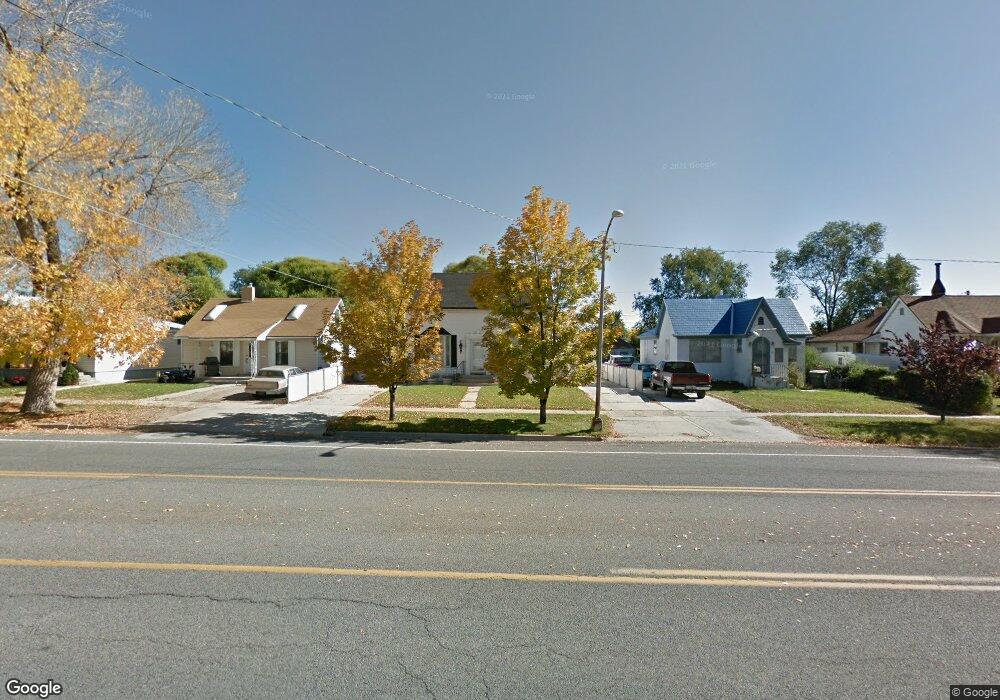
This home is located at 240 N 300 E, Price, UT 84501 and is currently estimated at $457,483, approximately $349 per square foot. 240 N 300 E is a home located in Carbon County with nearby schools including Castle Heights School, Mont Harmon Junior High School, and Carbon High School.
Ownership History
Date
Name
Owned For
Owner Type
Purchase Details
Closed on
Mar 28, 2022
Sold by
Russell Woodruff
Bought by
Russell And Melanie Woodruff Family Revocable
Current Estimated Value
Purchase Details
Closed on
Mar 27, 2020
Sold by
Woodruff Clifford A
Bought by
Woodruff Clifford A
Purchase Details
Closed on
Jul 7, 2007
Sold by
Anderson Julia T
Bought by
Woodruff Clifford A and Woodruff Louise T
Home Financials for this Owner
Home Financials are based on the most recent Mortgage that was taken out on this home.
Original Mortgage
$30,000
Interest Rate
6.36%
Mortgage Type
Purchase Money Mortgage
Purchase Details
Closed on
Jun 6, 2007
Sold by
Woodruff Clifford and Woodruff Louise T
Bought by
Woodruff Clifford A and Woodruff Louise T
Home Financials for this Owner
Home Financials are based on the most recent Mortgage that was taken out on this home.
Original Mortgage
$30,000
Interest Rate
6.36%
Mortgage Type
Purchase Money Mortgage
Create a Home Valuation Report for This Property
The Home Valuation Report is an in-depth analysis detailing your home's value as well as a comparison with similar homes in the area
Purchase History
| Date | Buyer | Sale Price | Title Company |
|---|---|---|---|
| Russell And Melanie Woodruff Family Revocable | -- | None Listed On Document | |
| Woodruff Clifford A | -- | None Available | |
| Woodruff Clifford A | -- | South Eastern Utah Title Co | |
| Woodruff Clifford A | -- | South Eastern Utah Title Co |
Source: Public Records
Mortgage History
| Date | Status | Borrower | Loan Amount |
|---|---|---|---|
| Previous Owner | Woodruff Clifford A | $30,000 |
Source: Public Records
Tax History
| Year | Tax Paid | Tax Assessment Tax Assessment Total Assessment is a certain percentage of the fair market value that is determined by local assessors to be the total taxable value of land and additions on the property. | Land | Improvement |
|---|---|---|---|---|
| 2025 | $4,963 | $222,736 | $34,754 | $187,982 |
| 2024 | $4,362 | $199,341 | $27,500 | $171,841 |
| 2023 | $4,120 | $201,594 | $41,909 | $159,685 |
| 2022 | $4,047 | $175,276 | $30,107 | $145,169 |
| 2021 | $3,864 | $266,086 | $43,391 | $222,695 |
| 2020 | $3,337 | $210,112 | $0 | $0 |
| 2019 | $2,529 | $197,174 | $0 | $0 |
| 2018 | $1,992 | $159,853 | $0 | $0 |
| 2017 | $1,818 | $147,958 | $0 | $0 |
| 2016 | $1,571 | $144,752 | $0 | $0 |
| 2015 | $1,571 | $144,752 | $0 | $0 |
| 2014 | $1,540 | $144,752 | $0 | $0 |
| 2013 | $1,555 | $144,752 | $0 | $0 |
Source: Public Records
Map
Nearby Homes
Your Personal Tour Guide
Ask me questions while you tour the home.