Estimated Value: $306,000 - $411,000
Studio
--
Bath
--
Sq Ft
8,712
Sq Ft Lot
About This Home
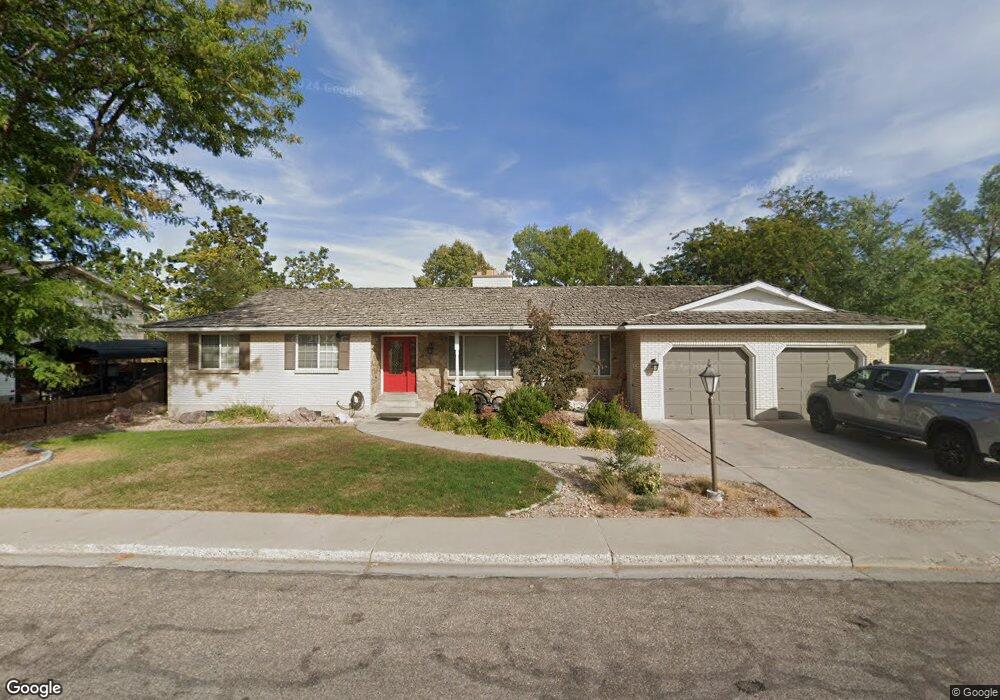
This home is located at 240 N 420 E, Delta, UT 84624 and is currently estimated at $358,314. 240 N 420 E is a home with nearby schools including Cba Center and White River Academy.
Ownership History
Date
Name
Owned For
Owner Type
Purchase Details
Closed on
Nov 17, 2021
Sold by
Sentker Jake E and Sentker Camille
Bought by
Sentker Jake E
Current Estimated Value
Home Financials for this Owner
Home Financials are based on the most recent Mortgage that was taken out on this home.
Original Mortgage
$280,000
Outstanding Balance
$256,250
Interest Rate
3.05%
Mortgage Type
New Conventional
Estimated Equity
$102,064
Purchase Details
Closed on
May 23, 2013
Sold by
Nelson Bill J
Bought by
Sentker Jake E and Sentker Camille
Home Financials for this Owner
Home Financials are based on the most recent Mortgage that was taken out on this home.
Original Mortgage
$180,500
Interest Rate
3.37%
Mortgage Type
New Conventional
Create a Home Valuation Report for This Property
The Home Valuation Report is an in-depth analysis detailing your home's value as well as a comparison with similar homes in the area
Home Values in the Area
Average Home Value in this Area
Purchase History
| Date | Buyer | Sale Price | Title Company |
|---|---|---|---|
| Sentker Jake E | -- | First American Title | |
| Sentker Jake E | -- | -- |
Source: Public Records
Mortgage History
| Date | Status | Borrower | Loan Amount |
|---|---|---|---|
| Open | Sentker Jake E | $280,000 | |
| Closed | Sentker Jake E | $180,500 |
Source: Public Records
Tax History
| Year | Tax Paid | Tax Assessment Tax Assessment Total Assessment is a certain percentage of the fair market value that is determined by local assessors to be the total taxable value of land and additions on the property. | Land | Improvement |
|---|---|---|---|---|
| 2025 | $2,623 | $280,669 | $15,710 | $264,959 |
| 2024 | $2,623 | $221,916 | $14,485 | $207,431 |
| 2023 | $2,737 | $221,916 | $14,485 | $207,431 |
| 2022 | $2,073 | $155,994 | $13,168 | $142,826 |
| 2021 | $1,782 | $128,043 | $11,450 | $116,593 |
| 2020 | $1,660 | $118,501 | $10,409 | $108,092 |
| 2019 | $1,557 | $111,236 | $10,106 | $101,130 |
| 2018 | $1,428 | $102,886 | $10,106 | $92,780 |
| 2017 | $1,482 | $102,886 | $10,106 | $92,780 |
| 2016 | $1,437 | $102,886 | $10,106 | $92,780 |
| 2015 | $1,436 | $102,886 | $10,106 | $92,780 |
| 2014 | -- | $104,058 | $10,106 | $93,952 |
| 2013 | -- | $104,058 | $10,106 | $93,952 |
Source: Public Records
Map
Nearby Homes
- 7900 E 250 Rd N
- 445 Topaz Blvd Unit 10
- 520 E 450 North Rd
- 628 Sunset St
- 44 E 300 S
- 0 E Highway 6 Unit LotWP001 16586023
- 87 S 300 East Rd
- 901 E 750 Rd N
- Locust Ave Unit LotWP001
- 321 E 200 S
- 325 N 100 W
- 648 Tamarix St
- 38 E 300 S
- 32 E 300 S
- 163 W 100 S
- 700 N Highway 6
- 98 W 1000 N
- 341 W 100 S
- 451 W 300 N
- 294 S 300 W
Your Personal Tour Guide
Ask me questions while you tour the home.