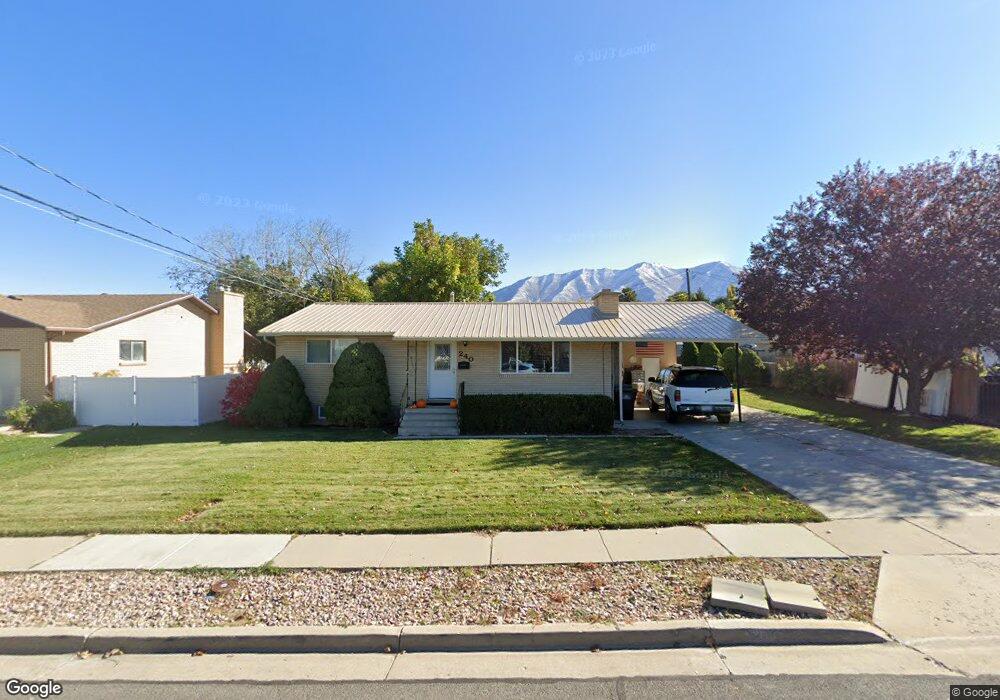
240 N 800 E Spanish Fork, UT 84660
Estimated Value: $423,000 - $470,577
4
Beds
2
Baths
2,324
Sq Ft
$191/Sq Ft
Est. Value
About This Home
This home is located at 240 N 800 E, Spanish Fork, UT 84660 and is currently estimated at $444,192, approximately $191 per square foot. 240 N 800 E is a home located in Utah County with nearby schools including Park Elementary School, Spanish Fork Jr High School, and Spanish Fork High School.
Ownership History
Date
Name
Owned For
Owner Type
Purchase Details
Closed on
Dec 16, 2020
Sold by
Cole John Martin
Bought by
Cole John Martin and Cole Rebecca
Current Estimated Value
Home Financials for this Owner
Home Financials are based on the most recent Mortgage that was taken out on this home.
Original Mortgage
$105,100
Outstanding Balance
$76,292
Interest Rate
2.7%
Mortgage Type
New Conventional
Estimated Equity
$367,900
Purchase Details
Closed on
Mar 5, 2007
Sold by
Hatch Vernon Carnell and Hatch Verla Mae
Bought by
Dinkel Brad and Dinkel Alisse
Home Financials for this Owner
Home Financials are based on the most recent Mortgage that was taken out on this home.
Original Mortgage
$188,000
Outstanding Balance
$151,164
Interest Rate
6.23%
Mortgage Type
Purchase Money Mortgage
Estimated Equity
$293,028
Create a Home Valuation Report for This Property
The Home Valuation Report is an in-depth analysis detailing your home's value as well as a comparison with similar homes in the area
Home Values in the Area
Average Home Value in this Area
Purchase History
| Date | Buyer | Sale Price | Title Company |
|---|---|---|---|
| Cole John Martin | -- | Accommodation | |
| Dinkel Brad | -- | First American Title Agency |
Source: Public Records
Mortgage History
| Date | Status | Borrower | Loan Amount |
|---|---|---|---|
| Open | Cole John Martin | $105,100 | |
| Open | Dinkel Brad | $188,000 |
Source: Public Records
Tax History
| Year | Tax Paid | Tax Assessment Tax Assessment Total Assessment is a certain percentage of the fair market value that is determined by local assessors to be the total taxable value of land and additions on the property. | Land | Improvement |
|---|---|---|---|---|
| 2025 | $2,083 | $231,660 | -- | -- |
| 2024 | $2,083 | $214,720 | $0 | $0 |
| 2023 | $2,147 | $221,595 | $0 | $0 |
| 2022 | $2,166 | $219,175 | $0 | $0 |
| 2021 | $1,955 | $316,500 | $88,400 | $228,100 |
| 2020 | $1,774 | $279,200 | $73,700 | $205,500 |
| 2019 | $1,524 | $252,400 | $73,700 | $178,700 |
| 2018 | $1,431 | $229,100 | $73,700 | $155,400 |
| 2017 | $1,383 | $119,020 | $0 | $0 |
| 2016 | $1,193 | $101,310 | $0 | $0 |
| 2015 | $1,099 | $92,235 | $0 | $0 |
| 2014 | $1,046 | $88,110 | $0 | $0 |
Source: Public Records
Map
Nearby Homes
- 265 N 800 E
- 284 N 1000 E
- 306 N 1070 E
- 306 N 1070 E Unit 17
- 274 N 1070 E Unit 14
- 299 N 1070 E Unit 8
- 212 N 1070 E Unit 9
- 679 E 400 N
- 314 N 1070 E
- 998 E 260 N Unit 16
- 992 E 260 N Unit 15
- 270 N 500 E
- 973 E 60 S
- 136 N 1120 E
- 453 N 1210 E
- 284 N 400 E
- 1074 E 660 N
- 1025 E 360 N Unit 5
- 1022 E 360 N Unit 27
- 991 E 360 N Unit 8
Your Personal Tour Guide
Ask me questions while you tour the home.