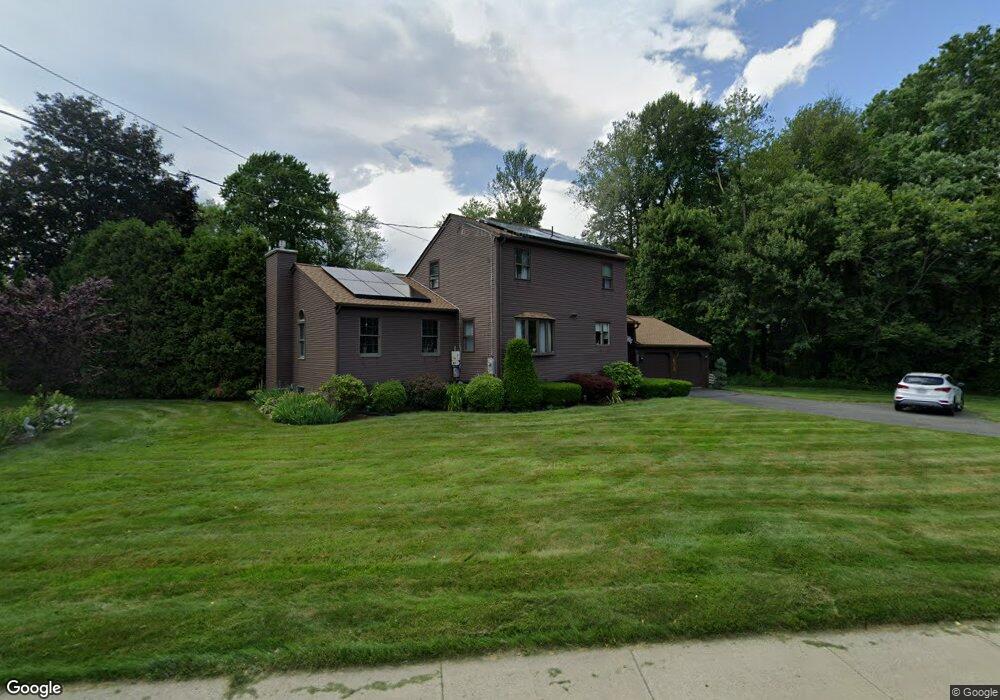
240 Porter Rd East Longmeadow, MA 01028
Estimated Value: $464,000 - $544,000
3
Beds
3
Baths
2,144
Sq Ft
$237/Sq Ft
Est. Value
About This Home
This home is located at 240 Porter Rd, East Longmeadow, MA 01028 and is currently estimated at $508,326, approximately $237 per square foot. 240 Porter Rd is a home located in Hampden County with nearby schools including Meadowbrook Elementary School, Birchland Park Middle School, and East Longmeadow High School.
Ownership History
Date
Name
Owned For
Owner Type
Purchase Details
Closed on
Nov 29, 2010
Sold by
Caldarola Maria F and Caldarola James F
Bought by
Caldarola James F
Current Estimated Value
Home Financials for this Owner
Home Financials are based on the most recent Mortgage that was taken out on this home.
Original Mortgage
$168,000
Outstanding Balance
$111,164
Interest Rate
4.25%
Mortgage Type
Purchase Money Mortgage
Estimated Equity
$397,162
Purchase Details
Closed on
Oct 21, 1994
Sold by
Ouellet Allan J and Ouellet Josephine A
Bought by
Caldarola James F and Caldarola Maria F
Home Financials for this Owner
Home Financials are based on the most recent Mortgage that was taken out on this home.
Original Mortgage
$133,650
Interest Rate
8.49%
Mortgage Type
Purchase Money Mortgage
Create a Home Valuation Report for This Property
The Home Valuation Report is an in-depth analysis detailing your home's value as well as a comparison with similar homes in the area
Home Values in the Area
Average Home Value in this Area
Purchase History
| Date | Buyer | Sale Price | Title Company |
|---|---|---|---|
| Caldarola James F | -- | -- | |
| Caldarola James F | $148,500 | -- |
Source: Public Records
Mortgage History
| Date | Status | Borrower | Loan Amount |
|---|---|---|---|
| Open | Caldarola James F | $168,000 | |
| Previous Owner | Caldarola James F | $97,767 | |
| Previous Owner | Caldarola James F | $137,000 | |
| Previous Owner | Caldarola James F | $133,650 | |
| Previous Owner | Caldarola James F | $165,000 |
Source: Public Records
Tax History Compared to Growth
Tax History
| Year | Tax Paid | Tax Assessment Tax Assessment Total Assessment is a certain percentage of the fair market value that is determined by local assessors to be the total taxable value of land and additions on the property. | Land | Improvement |
|---|---|---|---|---|
| 2025 | $8,129 | $439,900 | $128,500 | $311,400 |
| 2024 | $7,748 | $417,900 | $128,500 | $289,400 |
| 2023 | $7,411 | $386,000 | $116,300 | $269,700 |
| 2022 | $7,142 | $352,000 | $104,900 | $247,100 |
| 2021 | $7,049 | $334,700 | $97,200 | $237,500 |
| 2020 | $6,794 | $326,000 | $97,200 | $228,800 |
| 2019 | $6,518 | $317,200 | $94,300 | $222,900 |
| 2018 | $6,318 | $301,700 | $94,300 | $207,400 |
| 2017 | $6,162 | $296,700 | $92,500 | $204,200 |
| 2016 | $6,163 | $291,800 | $89,600 | $202,200 |
| 2015 | $6,046 | $291,800 | $89,600 | $202,200 |
Source: Public Records
Map
Nearby Homes