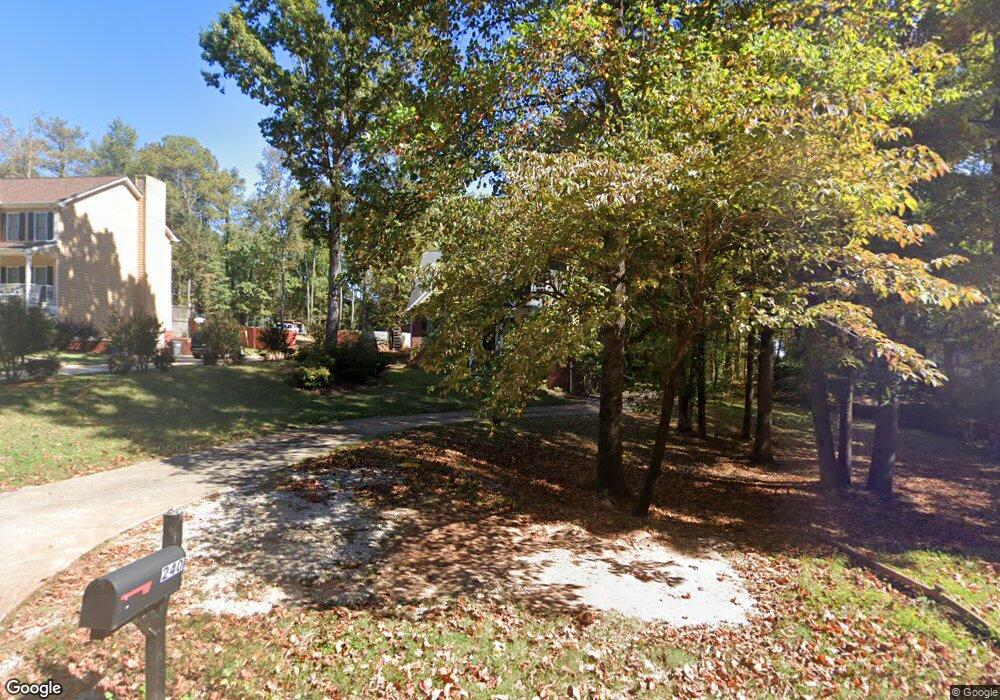
240 Radcliffe Trace Covington, GA 30016
Estimated Value: $289,000 - $342,000
4
Beds
3
Baths
1,749
Sq Ft
$184/Sq Ft
Est. Value
About This Home
This home is located at 240 Radcliffe Trace, Covington, GA 30016 and is currently estimated at $321,452, approximately $183 per square foot. 240 Radcliffe Trace is a home located in Newton County with nearby schools including West Newton Elementary School, Veterans Memorial Middle School, and Newton High School.
Ownership History
Date
Name
Owned For
Owner Type
Purchase Details
Closed on
Dec 10, 2020
Sold by
Toyer Hollis S
Bought by
Simon Jason C
Current Estimated Value
Home Financials for this Owner
Home Financials are based on the most recent Mortgage that was taken out on this home.
Original Mortgage
$194,485
Outstanding Balance
$172,272
Interest Rate
2.8%
Mortgage Type
New Conventional
Estimated Equity
$149,180
Purchase Details
Closed on
Jul 11, 2018
Sold by
Coger James B
Bought by
Toyer Hollis S and Toyer Toyer
Purchase Details
Closed on
Sep 6, 2002
Sold by
Coger Jacqueline
Bought by
Coger James
Purchase Details
Closed on
Mar 30, 1995
Sold by
Banks Camille
Bought by
Coger James
Purchase Details
Closed on
Sep 14, 1994
Sold by
Ernest Howell Inc
Bought by
Banks Camille
Home Financials for this Owner
Home Financials are based on the most recent Mortgage that was taken out on this home.
Original Mortgage
$82,500
Interest Rate
8.37%
Mortgage Type
Construction
Create a Home Valuation Report for This Property
The Home Valuation Report is an in-depth analysis detailing your home's value as well as a comparison with similar homes in the area
Home Values in the Area
Average Home Value in this Area
Purchase History
| Date | Buyer | Sale Price | Title Company |
|---|---|---|---|
| Simon Jason C | $200,500 | -- | |
| Toyer Hollis S | $154,000 | -- | |
| Coger James | -- | -- | |
| Coger James | $116,300 | -- | |
| Banks Camille | $15,500 | -- |
Source: Public Records
Mortgage History
| Date | Status | Borrower | Loan Amount |
|---|---|---|---|
| Open | Simon Jason C | $194,485 | |
| Previous Owner | Banks Camille | $82,500 | |
| Closed | Coger James | $0 |
Source: Public Records
Tax History
| Year | Tax Paid | Tax Assessment Tax Assessment Total Assessment is a certain percentage of the fair market value that is determined by local assessors to be the total taxable value of land and additions on the property. | Land | Improvement |
|---|---|---|---|---|
| 2025 | $3,645 | $145,160 | $16,800 | $128,360 |
| 2024 | $3,748 | $146,680 | $16,800 | $129,880 |
| 2023 | $3,572 | $130,440 | $8,000 | $122,440 |
| 2022 | $3,489 | $127,360 | $8,000 | $119,360 |
| 2021 | $2,465 | $81,400 | $8,000 | $73,400 |
| 2020 | $1,040 | $59,200 | $8,000 | $51,200 |
| 2019 | $1,046 | $58,960 | $8,000 | $50,960 |
| 2018 | $1,780 | $50,920 | $8,000 | $42,920 |
| 2017 | $1,284 | $40,360 | $6,000 | $34,360 |
| 2016 | $1,100 | $35,000 | $4,000 | $31,000 |
| 2015 | $953 | $30,760 | $4,000 | $26,760 |
| 2014 | $952 | $30,760 | $0 | $0 |
Source: Public Records
Map
Nearby Homes
- 210 Fox Glove Dr
- 340 Radcliffe Trace
- 355 Radcliffe Trace
- 80 Fox Glove Dr Unit 3
- 45 Sunset Ct
- 2273 Hampton Trail SE
- 2184 Hampton Trail SE
- 45 Somerset Ct
- 2004 Nolan Way
- 210 Pinewood Dr
- 215 Pinewood Dr
- 3440 Concord Corner SE
- 1903 Old Concord Dr SE
- 2145 Hampton Trail SE
- 3789 Salem Rd
- 2075 Pinewood Dr
- 229 Lotus Ln Unit 25
- 234 Lotus Ln Unit 79
- 35 Springfield Way
- 3409 Salem Rd
- 250 Radcliffe Trace
- 230 Radcliffe Trace
- 260 Radcliffe Trace
- 260 Radcliffe Trace Unit 2
- 20 Cliff Ct
- 220 Radcliffe Trace
- 225 Radcliffe Trace
- 255 Radcliffe Trace
- 30 Cliff Ct
- 215 Radcliffe Trace
- 265 Radcliffe Trace
- 15 Trace Ct
- 25 Trace Ct
- 35 Cliff Ct
- 205 Radcliffe Trace
- 170 Fox Glove Dr
- 170 Fox Glove Dr Unit 3
- 15 Cliff Ct
- 275 Radcliffe Trace
- 233 Valley Rd
Your Personal Tour Guide
Ask me questions while you tour the home.