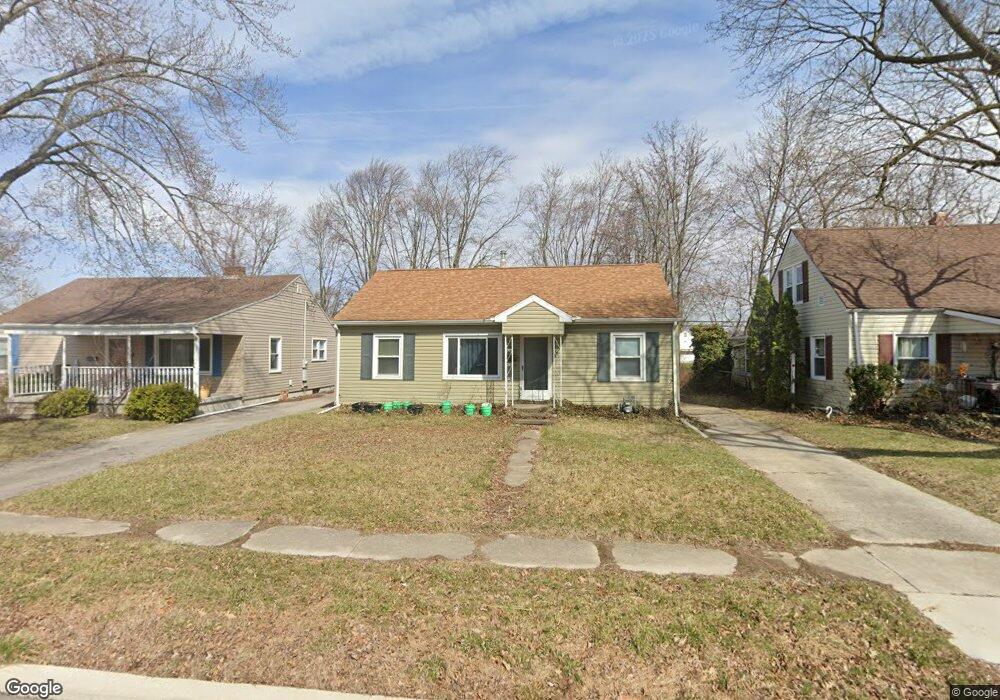
240 Rector Ave Findlay, OH 45840
Estimated Value: $159,488 - $177,000
3
Beds
1
Bath
1,200
Sq Ft
$140/Sq Ft
Est. Value
About This Home
This home is located at 240 Rector Ave, Findlay, OH 45840 and is currently estimated at $168,372, approximately $140 per square foot. 240 Rector Ave is a home located in Hancock County with nearby schools including Northview Elementary School, Bigelow Hill Elementary School, and Glenwood Middle School.
Ownership History
Date
Name
Owned For
Owner Type
Purchase Details
Closed on
Nov 14, 2006
Sold by
Dosh Rosalie A
Bought by
Depinet Bruce A
Current Estimated Value
Home Financials for this Owner
Home Financials are based on the most recent Mortgage that was taken out on this home.
Original Mortgage
$9,250
Outstanding Balance
$5,558
Interest Rate
6.4%
Mortgage Type
Unknown
Estimated Equity
$162,814
Purchase Details
Closed on
Oct 27, 1994
Sold by
Miller Nicholas
Bought by
Dosh Richard and Dosh Rosalie
Purchase Details
Closed on
Jun 4, 1993
Bought by
Gatliff Tammie M
Purchase Details
Closed on
Mar 10, 1992
Bought by
Horvath Robert J and Horvath Joanie
Purchase Details
Closed on
Jan 24, 1991
Bought by
Marquart Jennifer L
Purchase Details
Closed on
Nov 20, 1984
Bought by
Marrick Garrick D
Purchase Details
Closed on
Jul 1, 1983
Bought by
Page Allen and Page Janet J
Create a Home Valuation Report for This Property
The Home Valuation Report is an in-depth analysis detailing your home's value as well as a comparison with similar homes in the area
Home Values in the Area
Average Home Value in this Area
Purchase History
| Date | Buyer | Sale Price | Title Company |
|---|---|---|---|
| Depinet Bruce A | $92,500 | Attorney | |
| Dosh Richard | $69,000 | -- | |
| Gatliff Tammie M | $62,500 | -- | |
| Horvath Robert J | $59,000 | -- | |
| Marquart Jennifer L | -- | -- | |
| Marrick Garrick D | $49,000 | -- | |
| Page Allen | $46,500 | -- |
Source: Public Records
Mortgage History
| Date | Status | Borrower | Loan Amount |
|---|---|---|---|
| Open | Depinet Bruce A | $9,250 | |
| Open | Depinet Bruce A | $74,000 |
Source: Public Records
Tax History
| Year | Tax Paid | Tax Assessment Tax Assessment Total Assessment is a certain percentage of the fair market value that is determined by local assessors to be the total taxable value of land and additions on the property. | Land | Improvement |
|---|---|---|---|---|
| 2024 | $1,407 | $39,610 | $4,990 | $34,620 |
| 2023 | $1,409 | $39,610 | $4,990 | $34,620 |
| 2022 | $1,404 | $39,610 | $4,990 | $34,620 |
| 2021 | $1,247 | $30,640 | $4,990 | $25,650 |
| 2020 | $1,247 | $30,640 | $4,990 | $25,650 |
| 2019 | $1,222 | $30,640 | $4,990 | $25,650 |
| 2018 | $1,111 | $25,560 | $3,990 | $21,570 |
| 2017 | $556 | $25,560 | $3,990 | $21,570 |
| 2016 | $1,105 | $25,560 | $3,990 | $21,570 |
| 2015 | $1,043 | $23,840 | $3,990 | $19,850 |
| 2014 | $1,043 | $23,840 | $3,990 | $19,850 |
| 2012 | $1,127 | $25,570 | $3,990 | $21,580 |
Source: Public Records
Map
Nearby Homes
- 232 Prentiss Ave
- 146 Clifton Ave
- 140 Monroe Ave
- 239 Edith Ave
- 421 Clifton Ave
- 315 W Melrose Ave
- 145 Madison Ave
- 329 W Melrose Ave
- 528 Rector Ave
- 2400 Hollybrook Dr
- 636 W Melrose Ave
- 701 W Melrose Ave
- 400 Rosewood Ave
- 245 Edinborough Dr
- 724 Edith Ave
- 2604 N Main St
- 241 Stanley Ave
- 206 Midland Ave
- 301 Allen Ave
- 705 Swing Ave
- 244 Rector Ave
- 236 Rector Ave
- 248 Rector Ave
- 232 Rector Ave
- 241 Prentiss Ave
- 245 Prentiss Ave
- 228 Rector Ave
- 250 Rector Ave
- 233 Prentiss Ave
- 255 Prentiss Ave
- 239 Rector Ave
- 245 Rector Ave
- 235 Rector Ave
- 224 Rector Ave
- 229 Prentiss Ave
- 300 Rector Ave
- 249 Rector Ave
- 231 Rector Ave
- 259 Rector Ave
- 255 Rector Ave
Your Personal Tour Guide
Ask me questions while you tour the home.