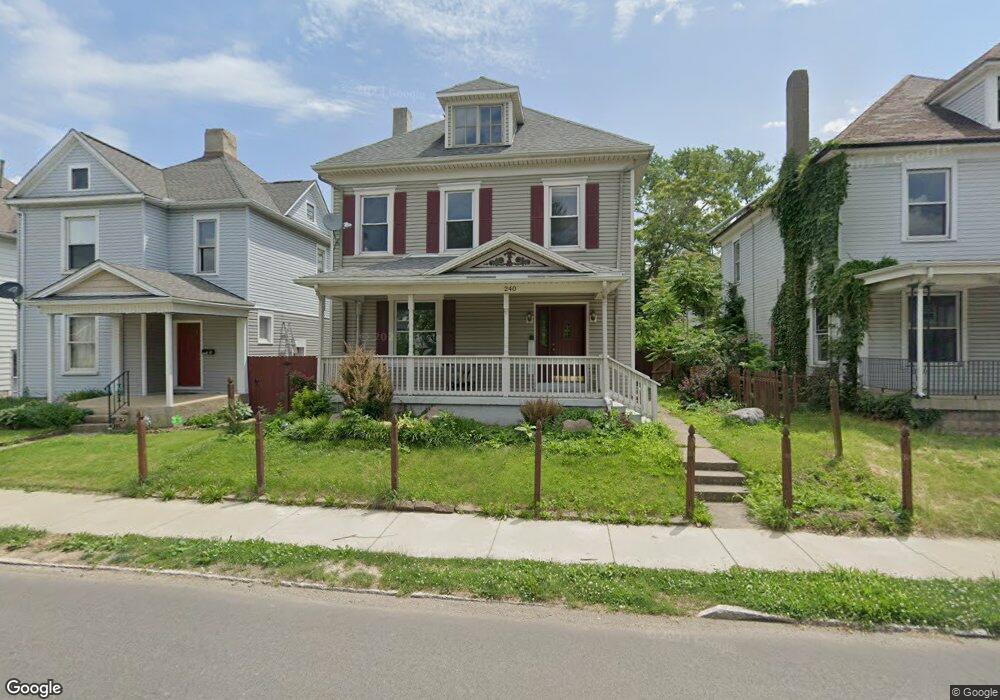
240 S Findlay St Dayton, OH 45403
Burkhardt NeighborhoodEstimated Value: $73,000 - $108,552
3
Beds
2
Baths
1,784
Sq Ft
$53/Sq Ft
Est. Value
About This Home
This home is located at 240 S Findlay St, Dayton, OH 45403 and is currently estimated at $94,388, approximately $52 per square foot. 240 S Findlay St is a home located in Montgomery County with nearby schools including Ruskin Elementary School, Kiser Elementary, and Horizon Science Academy Dayton Downtown.
Ownership History
Date
Name
Owned For
Owner Type
Purchase Details
Closed on
Aug 1, 2023
Sold by
Quintuna Leroy
Bought by
Quintuna Leroy and Huerta Tanya Mercedes
Current Estimated Value
Purchase Details
Closed on
Apr 1, 2020
Sold by
Pnc Bank National Association
Bought by
Quintuna Leroy
Purchase Details
Closed on
Feb 24, 2020
Sold by
Kallmayer Susan J
Bought by
Pnc Bank
Purchase Details
Closed on
Jul 16, 2003
Sold by
Kallmayer Susan J
Bought by
Kallmayer Susan J and Bledsoe Sheldia Jean
Purchase Details
Closed on
Nov 23, 1998
Sold by
Kreitzer Tina M
Bought by
Kallmayer Susan J
Purchase Details
Closed on
Nov 19, 1998
Sold by
Kreitzer George R and Kreitzer Joseph J
Bought by
Kreitzer Mary E
Purchase Details
Closed on
Nov 1, 1998
Sold by
Kreitzer George R and Kreitzer Joseph J
Bought by
Kreitzer Mary E
Purchase Details
Closed on
Oct 9, 1998
Sold by
Kreitzer George R and Kreitzer Joseph J
Bought by
Kreitzer Mary E
Create a Home Valuation Report for This Property
The Home Valuation Report is an in-depth analysis detailing your home's value as well as a comparison with similar homes in the area
Home Values in the Area
Average Home Value in this Area
Purchase History
| Date | Buyer | Sale Price | Title Company |
|---|---|---|---|
| Quintuna Leroy | -- | None Listed On Document | |
| Quintuna Leroy | $43,000 | Chicago Title Company | |
| Pnc Bank | $21,000 | None Available | |
| Kallmayer Susan J | -- | -- | |
| Kallmayer Susan J | $20,000 | -- | |
| Kallmayer Susan J | $20,000 | -- | |
| Kreitzer Mary E | -- | -- | |
| Kreitzer Mary E | -- | -- | |
| Kreitzer Mary E | -- | -- | |
| Kreitzer Mary E | -- | -- |
Source: Public Records
Tax History Compared to Growth
Tax History
| Year | Tax Paid | Tax Assessment Tax Assessment Total Assessment is a certain percentage of the fair market value that is determined by local assessors to be the total taxable value of land and additions on the property. | Land | Improvement |
|---|---|---|---|---|
| 2024 | $838 | $14,690 | $1,730 | $12,960 |
| 2023 | $838 | $14,690 | $1,730 | $12,960 |
| 2022 | $945 | $12,850 | $1,520 | $11,330 |
| 2021 | $940 | $12,850 | $1,520 | $11,330 |
| 2020 | $938 | $12,850 | $1,520 | $11,330 |
| 2019 | $903 | $11,060 | $1,520 | $9,540 |
| 2018 | $904 | $11,060 | $1,520 | $9,540 |
| 2017 | $897 | $11,060 | $1,520 | $9,540 |
| 2016 | $984 | $11,580 | $1,520 | $10,060 |
| 2015 | $931 | $11,580 | $1,520 | $10,060 |
| 2014 | $931 | $11,580 | $1,520 | $10,060 |
| 2012 | -- | $14,980 | $3,070 | $11,910 |
Source: Public Records
Map
Nearby Homes
- 240 Bierce Ave
- 639 Huffman Ave
- 755 Huffman Ave
- 240 S Torrence St
- 2821 E 5th St Unit 2819
- 102 S Findlay St
- 2929 E 5th St
- 2103 E 4th St
- 2341 E 5th St
- 241 Linden Ave
- 57 S Torrence St
- 2126 E 4th St
- 40 Klee Ave
- 223 Pleasant Ave
- 161 S Harbine Ave
- 60 Bell St
- 1018 Haviland Ave
- 3007 E 4th St
- 1024 Haviland Ave
- 800 Linden Ave
- 234 S Findlay St
- 244 S Findlay St
- 215 Bierce Ave
- 232 S Findlay St
- 226 S Findlay St
- 250 S Findlay St
- 39 Gerlaugh Ave
- 222 S Findlay St
- 43 Gerlaugh Ave Unit 2
- 43 Gerlaugh Ave
- 35 Gerlaugh Ave
- 254 S Findlay St
- 37 Gerlaugh Ave
- 239 S Findlay St
- 235 S Findlay St
- 218 S Findlay St
- 27 Gerlaugh Ave
- 243 S Findlay St
- 231 S Findlay St
- 249 S Findlay St