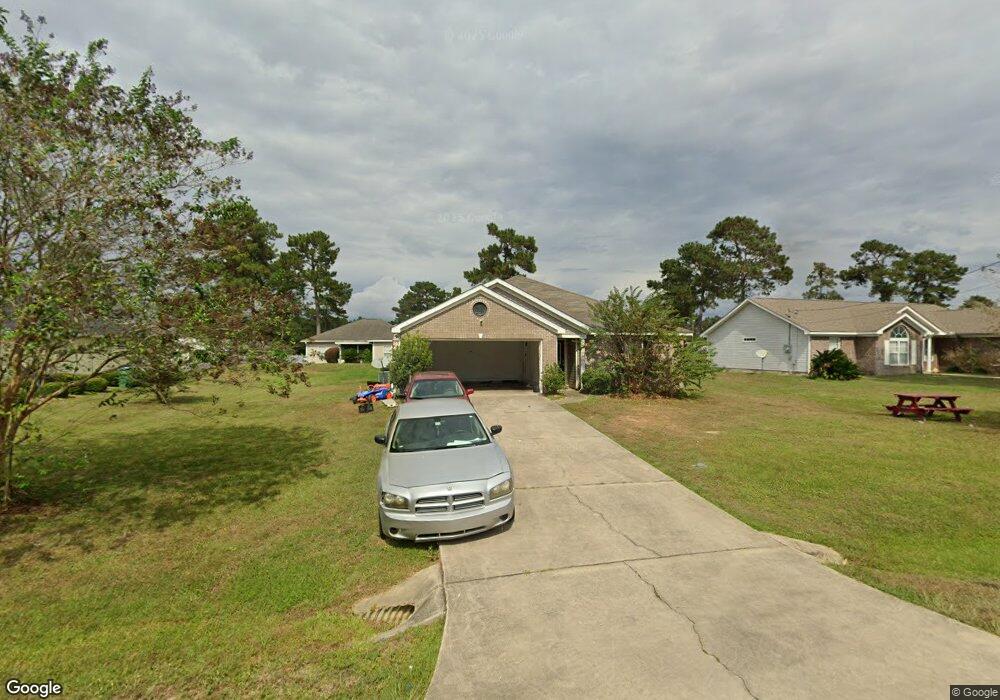
240 Slash Cir Midway, FL 32343
Estimated Value: $235,000 - $242,292
3
Beds
2
Baths
1,444
Sq Ft
$165/Sq Ft
Est. Value
About This Home
This home is located at 240 Slash Cir, Midway, FL 32343 and is currently estimated at $238,823, approximately $165 per square foot. 240 Slash Cir is a home located in Gadsden County.
Ownership History
Date
Name
Owned For
Owner Type
Purchase Details
Closed on
Aug 1, 2017
Bought by
Rushton Raven J
Current Estimated Value
Purchase Details
Closed on
Aug 26, 2009
Sold by
Fannie Mae
Bought by
Rushton Raven J
Home Financials for this Owner
Home Financials are based on the most recent Mortgage that was taken out on this home.
Original Mortgage
$116,910
Interest Rate
5.19%
Mortgage Type
FHA
Purchase Details
Closed on
Jun 11, 2009
Sold by
Dorsey Anthony and Gibbs Erika
Bought by
Federal National Mortgage Association
Purchase Details
Closed on
Jun 27, 2007
Sold by
Tricon Builders Inc
Bought by
Gibbs Erika and Dorsey Anthony
Home Financials for this Owner
Home Financials are based on the most recent Mortgage that was taken out on this home.
Original Mortgage
$169,000
Interest Rate
6.35%
Mortgage Type
New Conventional
Create a Home Valuation Report for This Property
The Home Valuation Report is an in-depth analysis detailing your home's value as well as a comparison with similar homes in the area
Home Values in the Area
Average Home Value in this Area
Purchase History
| Date | Buyer | Sale Price | Title Company |
|---|---|---|---|
| Rushton Raven J | $100 | -- | |
| Rushton Raven J | $120,000 | Attorney | |
| Federal National Mortgage Association | -- | None Available | |
| Gibbs Erika | $169,000 | North State Title Svcs Inc |
Source: Public Records
Mortgage History
| Date | Status | Borrower | Loan Amount |
|---|---|---|---|
| Previous Owner | Rushton Raven J | $116,910 | |
| Previous Owner | Gibbs Erika | $169,000 |
Source: Public Records
Tax History
| Year | Tax Paid | Tax Assessment Tax Assessment Total Assessment is a certain percentage of the fair market value that is determined by local assessors to be the total taxable value of land and additions on the property. | Land | Improvement |
|---|---|---|---|---|
| 2025 | $1,498 | $122,623 | -- | -- |
| 2024 | $1,442 | $119,168 | -- | -- |
| 2023 | $1,396 | $115,698 | $0 | $0 |
| 2022 | $1,336 | $112,329 | $0 | $0 |
| 2021 | $1,304 | $109,058 | $0 | $0 |
| 2020 | $1,273 | $107,553 | $0 | $0 |
| 2019 | $1,251 | $105,135 | $0 | $0 |
| 2018 | $1,247 | $103,175 | $0 | $0 |
| 2017 | $1,209 | $101,053 | $0 | $0 |
| 2016 | $1,184 | $98,975 | $0 | $0 |
| 2015 | $1,172 | $98,287 | $0 | $0 |
| 2014 | $1,141 | $97,507 | $0 | $0 |
Source: Public Records
Map
Nearby Homes
- 604 Rustling Pines Blvd
- 6 Slash Ln
- 545 Slash Cir
- 122 Loblolly Cir
- 305 Delores Madison Dr
- 34 Frank Run
- 396 Sand Pine Cir
- 17 Pine Bark Ln
- 25 Pine Bark Ln
- 668 M l King Blvd
- 359 Mae Cato Dr
- 407 Mae Cato Dr
- 31 Stevens Dr
- 0 Central Rd Unit 381525
- 8873 High Bridge Rd
- 8877 High Bridge Rd
- 380 Sumpter Ridge Dr
- 325 Mine Rd
- 00 Blue Star Hwy
- 10 Yvonne Ct
Your Personal Tour Guide
Ask me questions while you tour the home.