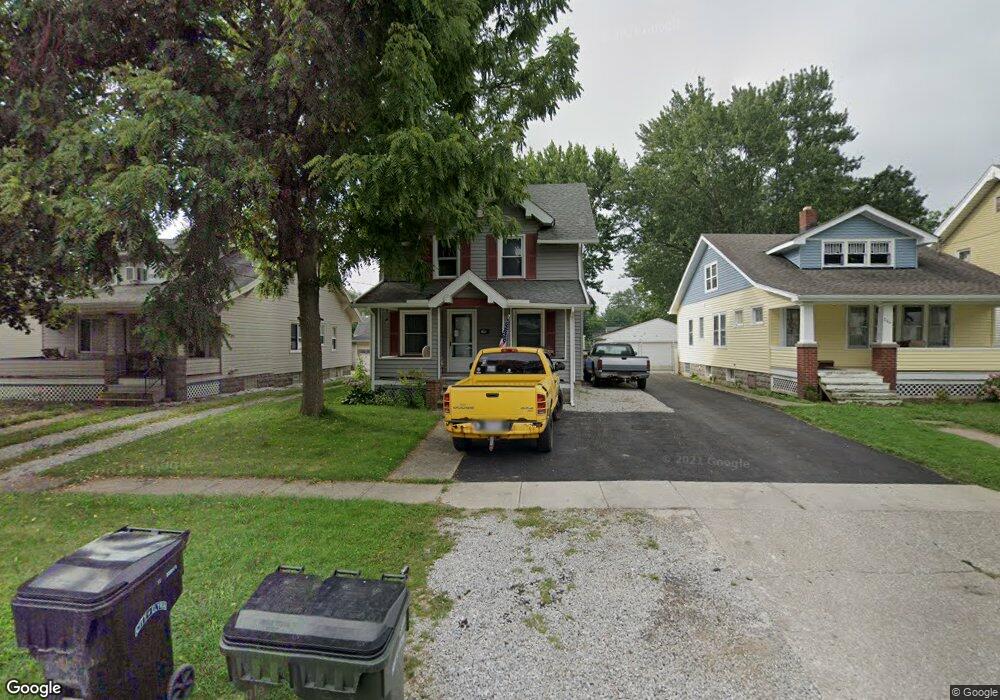
240 Spruce St Elyria, OH 44035
Estimated Value: $140,000 - $176,516
3
Beds
1
Bath
1,228
Sq Ft
$126/Sq Ft
Est. Value
About This Home
This home is located at 240 Spruce St, Elyria, OH 44035 and is currently estimated at $154,879, approximately $126 per square foot. 240 Spruce St is a home located in Lorain County with nearby schools including Westwood Middle School, Elyria High School, and St Mary Elementary School.
Ownership History
Date
Name
Owned For
Owner Type
Purchase Details
Closed on
Mar 19, 2003
Sold by
Conseco Finance Servicing Corp
Bought by
Bedocs Joseph A
Current Estimated Value
Home Financials for this Owner
Home Financials are based on the most recent Mortgage that was taken out on this home.
Original Mortgage
$72,000
Outstanding Balance
$31,111
Interest Rate
5.95%
Estimated Equity
$123,768
Purchase Details
Closed on
Nov 5, 2002
Sold by
Thornburg Dale R and Thornburg Kerstin E
Bought by
Conseco Finance Servicing Corp
Purchase Details
Closed on
Oct 13, 1998
Sold by
Miller Timothy J and Miller Sharon Ann
Bought by
Thornburg Dale R and Thornburg Kerstin E
Home Financials for this Owner
Home Financials are based on the most recent Mortgage that was taken out on this home.
Original Mortgage
$79,200
Interest Rate
6.9%
Create a Home Valuation Report for This Property
The Home Valuation Report is an in-depth analysis detailing your home's value as well as a comparison with similar homes in the area
Home Values in the Area
Average Home Value in this Area
Purchase History
| Date | Buyer | Sale Price | Title Company |
|---|---|---|---|
| Bedocs Joseph A | $72,000 | Truetitle Agency Inc | |
| Conseco Finance Servicing Corp | $55,000 | -- | |
| Thornburg Dale R | $88,000 | First Service Title Agency I |
Source: Public Records
Mortgage History
| Date | Status | Borrower | Loan Amount |
|---|---|---|---|
| Open | Bedocs Joseph A | $72,000 | |
| Previous Owner | Thornburg Dale R | $79,200 |
Source: Public Records
Tax History
| Year | Tax Paid | Tax Assessment Tax Assessment Total Assessment is a certain percentage of the fair market value that is determined by local assessors to be the total taxable value of land and additions on the property. | Land | Improvement |
|---|---|---|---|---|
| 2024 | $2,499 | $51,534 | $6,615 | $44,919 |
| 2023 | $1,830 | $32,771 | $7,133 | $25,638 |
| 2022 | $1,823 | $32,771 | $7,133 | $25,638 |
| 2021 | $1,828 | $32,771 | $7,133 | $25,638 |
| 2020 | $1,715 | $27,350 | $5,950 | $21,400 |
| 2019 | $1,704 | $27,350 | $5,950 | $21,400 |
| 2018 | $1,730 | $27,350 | $5,950 | $21,400 |
| 2017 | $1,753 | $26,410 | $6,290 | $20,120 |
| 2016 | $1,699 | $26,410 | $6,290 | $20,120 |
| 2015 | $1,593 | $26,410 | $6,290 | $20,120 |
| 2014 | $1,658 | $27,800 | $6,620 | $21,180 |
| 2013 | $1,643 | $27,800 | $6,620 | $21,180 |
Source: Public Records
Map
Nearby Homes
Your Personal Tour Guide
Ask me questions while you tour the home.