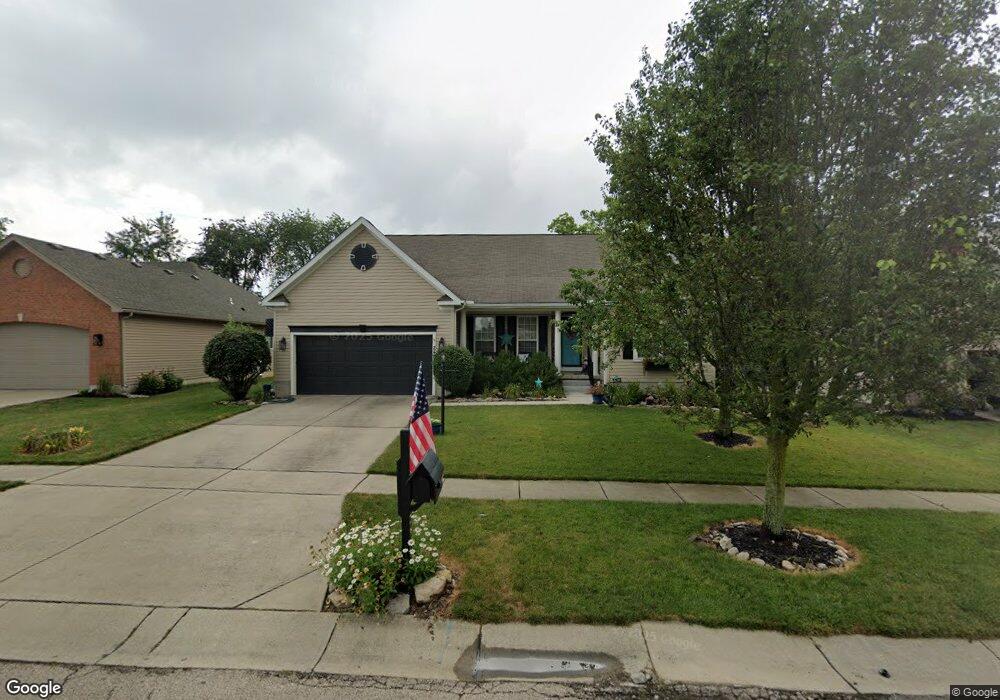
240 Stanton Dr Springboro, OH 45066
Estimated Value: $397,794 - $473,000
3
Beds
3
Baths
2,454
Sq Ft
$177/Sq Ft
Est. Value
About This Home
This home is located at 240 Stanton Dr, Springboro, OH 45066 and is currently estimated at $434,199, approximately $176 per square foot. 240 Stanton Dr is a home located in Warren County with nearby schools including Clearcreek Elementary School, Springboro Intermediate School, and Springboro Junior High School.
Ownership History
Date
Name
Owned For
Owner Type
Purchase Details
Closed on
May 9, 2024
Sold by
Towne Calvin D and Towne Linnea L
Bought by
Calvin And Linnea Towne Revocable Living Trus and Towne
Current Estimated Value
Purchase Details
Closed on
Aug 6, 2010
Sold by
Higgins Ashil K and Pyo Joon W
Bought by
Towne Calvin D and Towne Linnea L
Home Financials for this Owner
Home Financials are based on the most recent Mortgage that was taken out on this home.
Original Mortgage
$185,250
Interest Rate
4.63%
Mortgage Type
New Conventional
Purchase Details
Closed on
Feb 27, 2007
Sold by
Nvr Inc
Bought by
Pyo Joon W and Higgins Ashil K
Home Financials for this Owner
Home Financials are based on the most recent Mortgage that was taken out on this home.
Original Mortgage
$203,957
Interest Rate
6.4%
Mortgage Type
Unknown
Purchase Details
Closed on
Dec 12, 2006
Sold by
Coffman Development Co Inc
Bought by
Nvr Inc
Create a Home Valuation Report for This Property
The Home Valuation Report is an in-depth analysis detailing your home's value as well as a comparison with similar homes in the area
Home Values in the Area
Average Home Value in this Area
Purchase History
| Date | Buyer | Sale Price | Title Company |
|---|---|---|---|
| Calvin And Linnea Towne Revocable Living Trus | -- | None Listed On Document | |
| Towne Calvin D | $195,000 | M&M Title Co | |
| Pyo Joon W | $254,966 | First Title | |
| Nvr Inc | $54,000 | First Title |
Source: Public Records
Mortgage History
| Date | Status | Borrower | Loan Amount |
|---|---|---|---|
| Previous Owner | Towne Calvin D | $185,250 | |
| Previous Owner | Pyo Joon W | $203,957 |
Source: Public Records
Tax History
| Year | Tax Paid | Tax Assessment Tax Assessment Total Assessment is a certain percentage of the fair market value that is determined by local assessors to be the total taxable value of land and additions on the property. | Land | Improvement |
|---|---|---|---|---|
| 2025 | $4,626 | $118,460 | $26,250 | $92,210 |
| 2024 | $4,626 | $118,460 | $26,250 | $92,210 |
| 2023 | $4,045 | $94,986 | $16,520 | $78,466 |
| 2022 | $3,985 | $94,987 | $16,520 | $78,467 |
| 2021 | $3,709 | $94,987 | $16,520 | $78,467 |
| 2020 | $3,595 | $80,497 | $14,000 | $66,497 |
| 2019 | $3,315 | $80,497 | $14,000 | $66,497 |
| 2018 | $3,317 | $80,497 | $14,000 | $66,497 |
| 2017 | $3,518 | $76,902 | $13,013 | $63,889 |
| 2016 | $3,669 | $76,902 | $13,013 | $63,889 |
| 2015 | $3,641 | $74,288 | $13,013 | $61,275 |
| 2014 | $3,641 | $72,120 | $12,640 | $59,490 |
| 2013 | $3,638 | $79,920 | $14,000 | $65,920 |
Source: Public Records
Map
Nearby Homes
- 195 Oasis Ct
- 10084 Gully Pass Dr Unit 248
- 10084 Gully Pass Dr
- 10109 Gully Pass Dr Unit 250
- 10213 Gully Pass Dr Unit 251
- 2002 Glen Valley Dr
- 2005 Glen Valley Dr Unit 210
- 2005 Glen Valley Dr
- 182 Rippling Brook Ln
- 123 Rippling Brook Ln
- 160 Old Pond Rd
- 250 Ballard Dr
- 136 Waterhaven Way
- 33 Christman Dr
- 6 Waterlily Dr
- 80 Gregg Ct
- 85 Pebble Brook Place
- 365 Crockett Dr
- 25 Glass Ct
- 1620 Glade Valley Dr
Your Personal Tour Guide
Ask me questions while you tour the home.